


 117 / 220

TOTAL RETURNS (IN %)
The total return for the shareholder is measured by reference to the evolu-
tion of the share price and includes the distribution of the dividend or any
other distribution realised or paid by the company.
Assuming the reinvestment of the 2012 dividend made available for pay-
ment in 2013, the Cofinimmo share achieved a return of 7.5% over 2013.
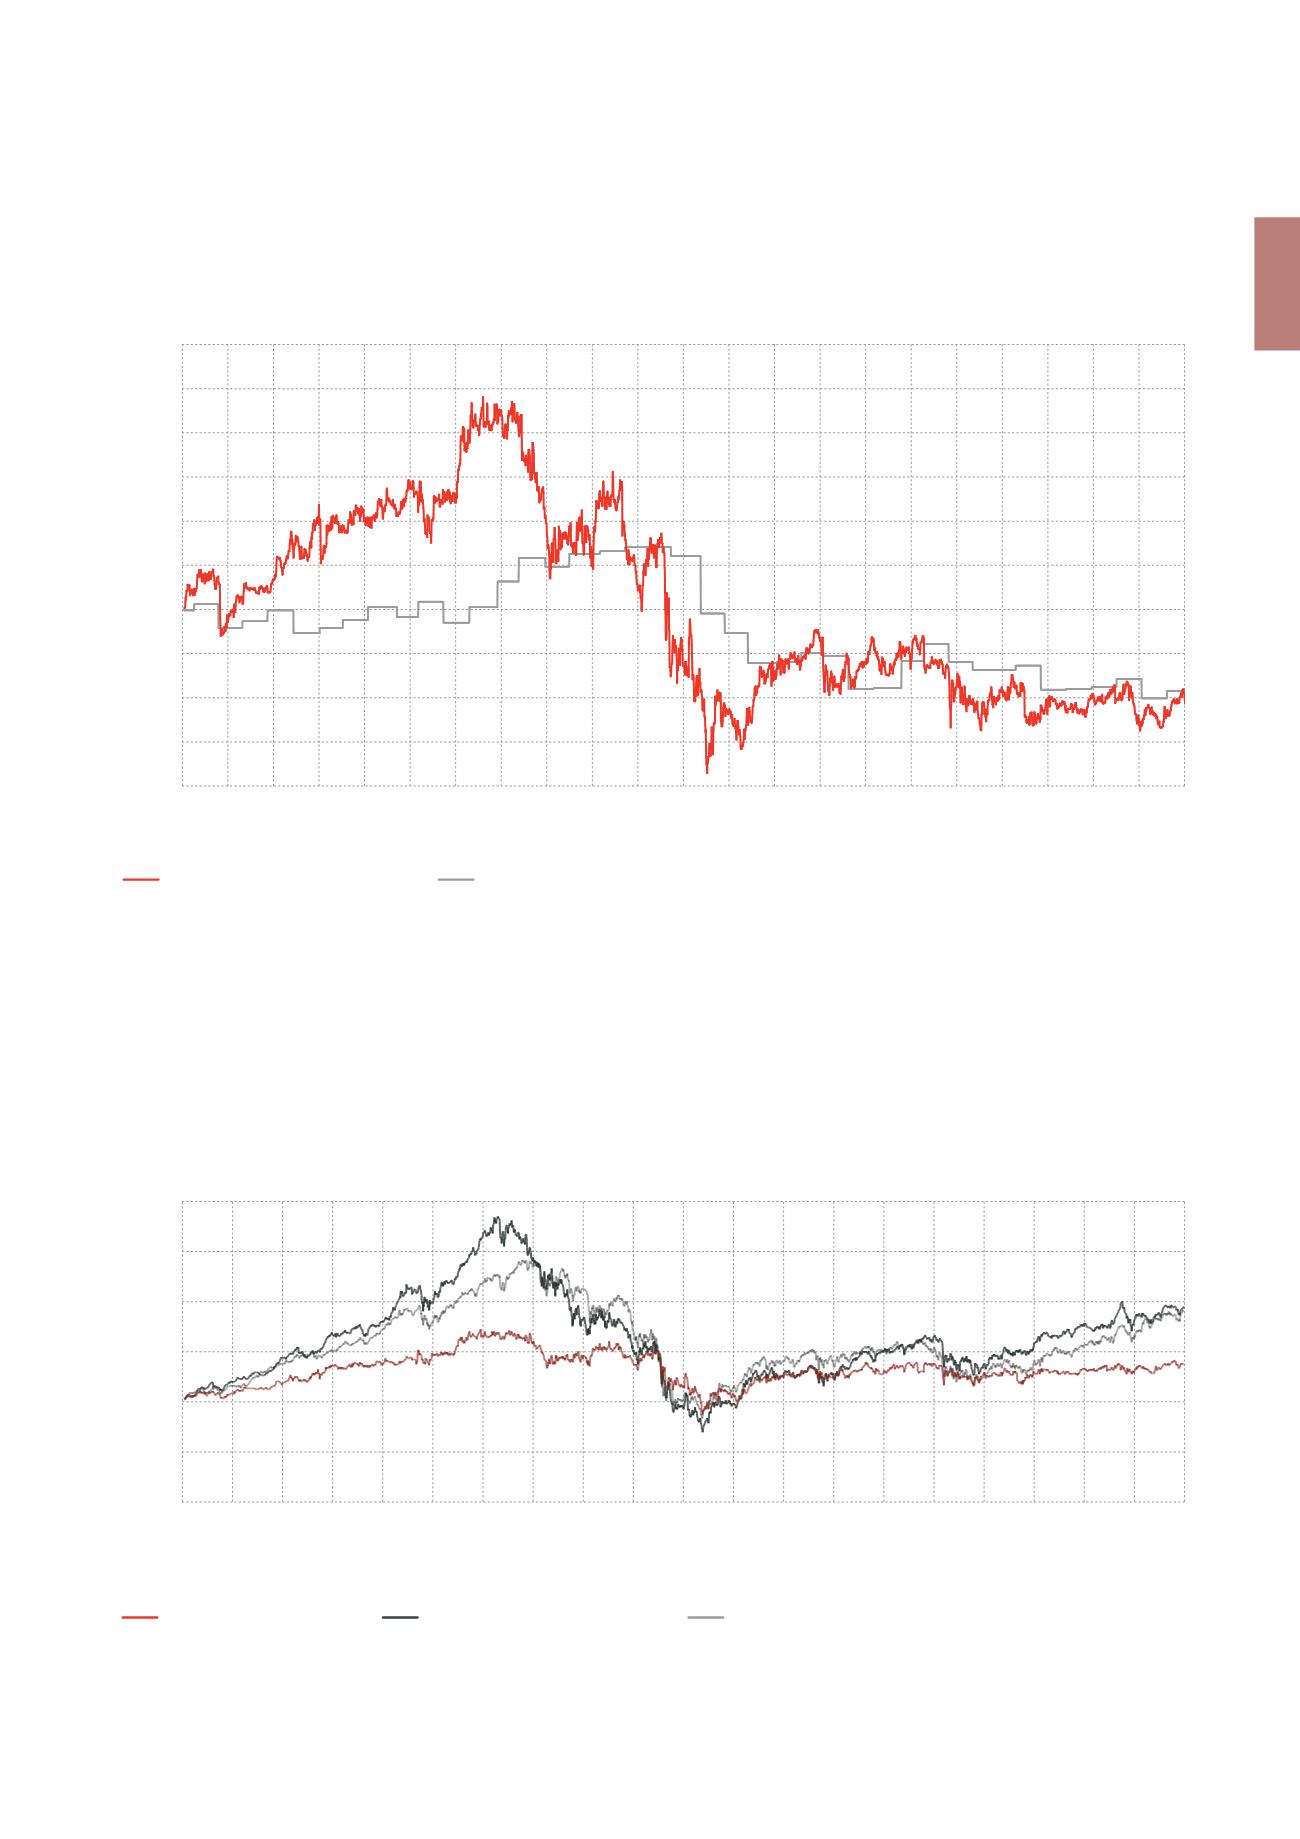
The graph below illustrates the stock market performances of the
Cofinimmo share compared to the BEL20 and EPRA Europe indexes
over the past ten years, dividend return included. During this period, the
Cofinimmo share generated a return of 36.3%, i.e. an annual average return
of 2.9%. The BEL20 and EPRA Europe indexes recorded variations of 88.7%
and 92.6% respectively, which corresponds to average annual yields of
5.9% and 6.8%.
COMPARISON OF SHARE PRICE VS. NET ASSET VALUE PER SHARE
(in €)
TOTAL RETURNS
Cofinimmo share price
Net asset value (in fair value)
170
160
150
140
130
120
110
100
90
80
70
Dec-03
Jul-04
Dec-04
Jul-05
Dec-05
Jul-06
Dec-06
Jul-07
Dec-07
Jul-08
Dec-08
Jul-09
Dec-09
Jul-10
Dec-10
Jul-11
Dec-11
Jul-12
Dec-12
Jul-13
Dec-13
Dec-03
Jul-04
Dec-04
Jul-05
Dec-05
Jul-06
Dec-06
Jul-07
Dec-07
Jul-08
Dec-08
Jul-09
Dec-09
Jul-10
Dec-10
Jul-11
Dec-11
Jul-12
Dec-12
Jul-13
Dec-13
70
80
90
100
110
120
130
140
150
160
170
0
50
100
150
200
250
300
31/12/13
30/06/13
31/12/12
30/06/12
31/12/11
30/06/11
31/12/10
30/06/10
31/12/09
30/06/09
31/12/08
30/06/08
31/12/07
30/06/07
31/12/06
30/06/06
31/12/05
30/06/05
31/12/04
30/06/04
31/12/03
Cofinimmo total return
300
250
200
150
100
50
0
EPRA Europe total return index
BEL20 total return index
\ 111
Cofinimmo in the Stock Market
\ Management Report