
BRUGES
GHENT
BRUSSELS
MONS
NAMUR
LIÈGE
ARLON
ANTWERP
HASSELT
GRONINGEN
DRENTHE
FRIESLAND
NORTH
HOLLAND
FLEVOLAND
OVERIJSSEL
GELDERLAND
ZEELAND
NORTH BRABANT
LIMBURG
SOUTH HOLLAND
UTRECHT
LEUVEN
WAVRE
12
133
8
120
106
103
92
18
20
67
18
23
99
43
21
17
1
1
1
4
9
11
128
2
2
2
4
2
4
1
2
14
10
74
3
PROPERTY REPORT
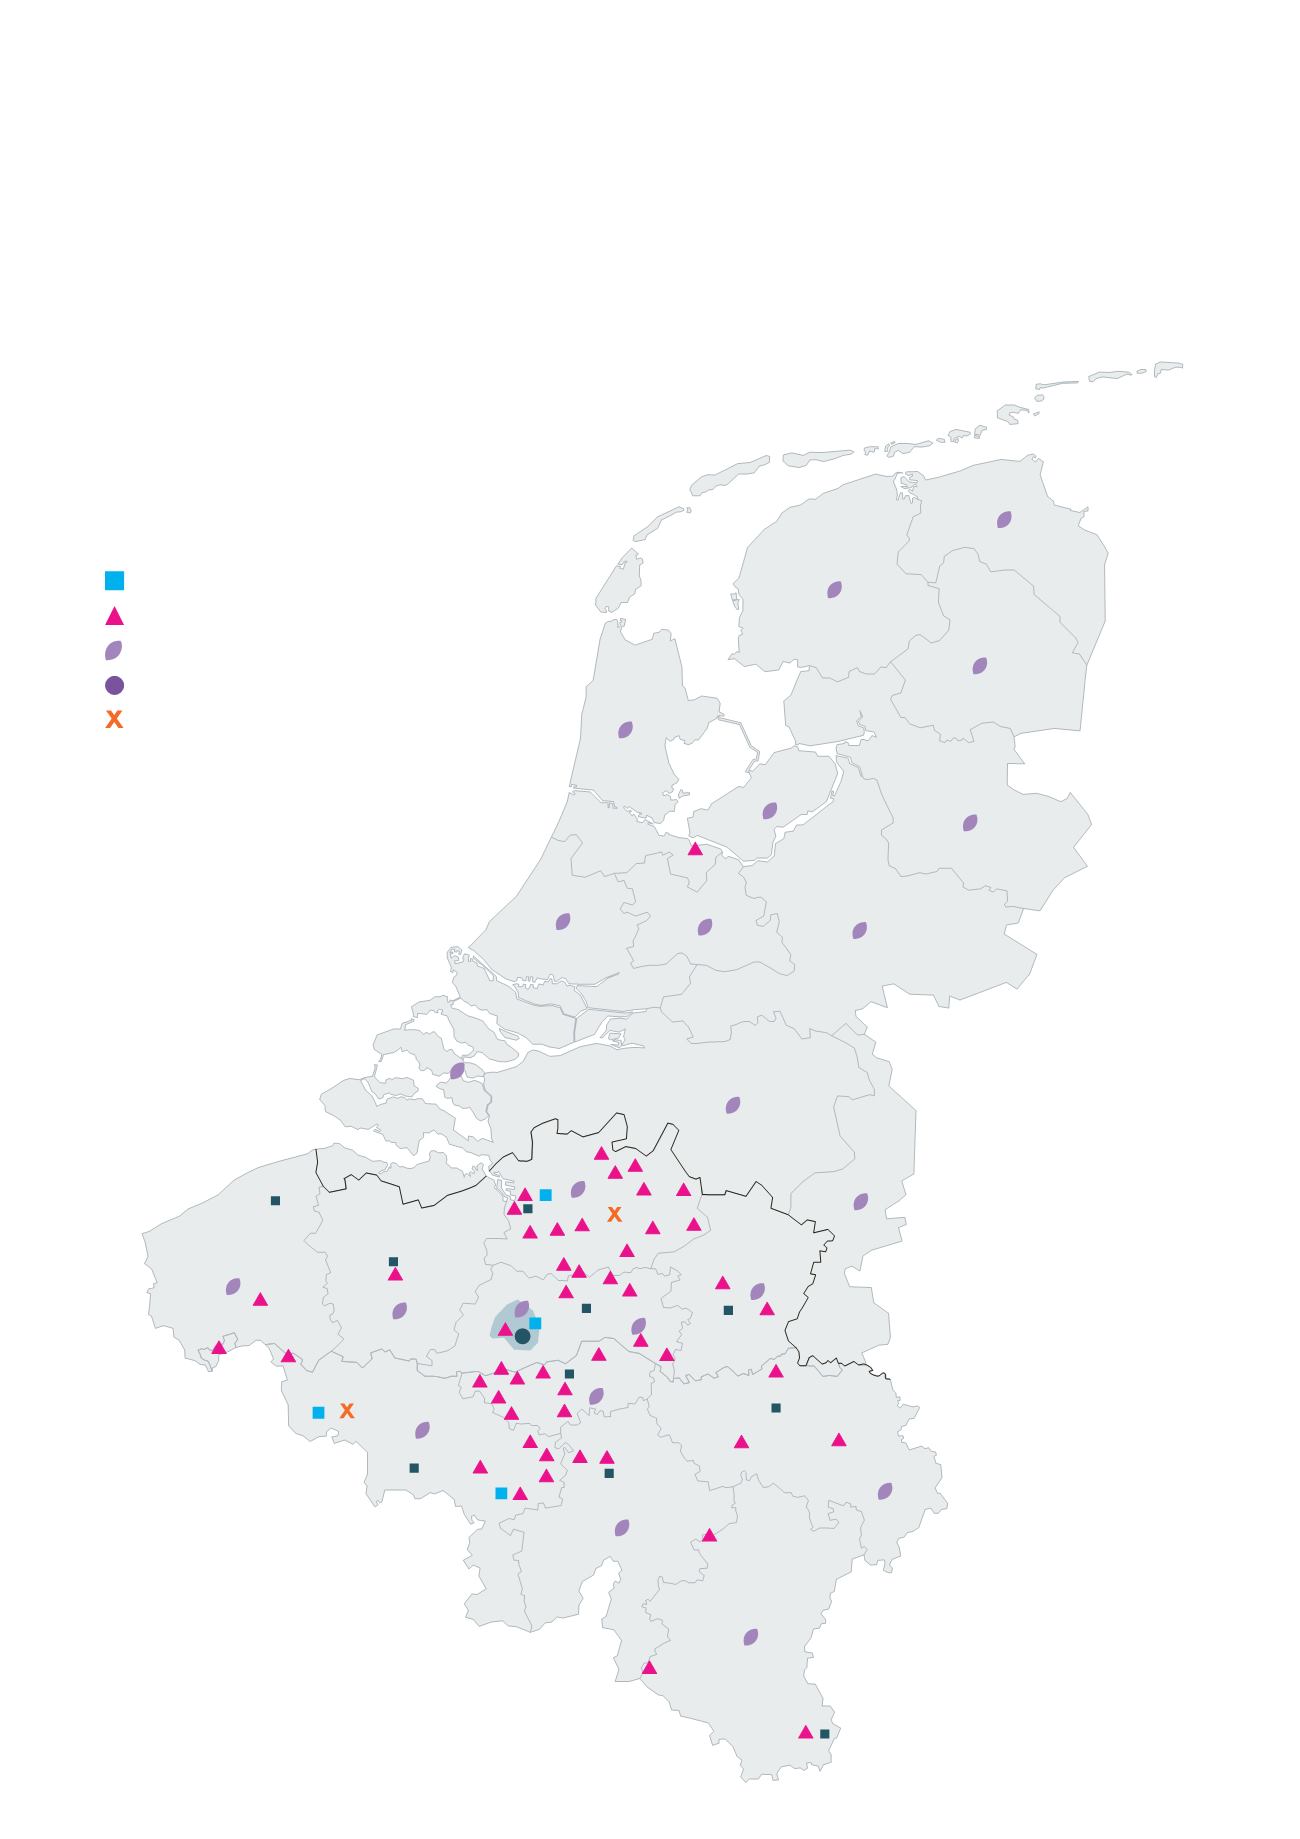
Office complexes are counted according to the number of buildings
that constitute them. Development projects are not counted.
x
Offices/Other buildings
x
Healthcare real estate
x
Pubstone
x
Cofinimur I
x
Public-Private Partnerships (PPP)
(x = number of properties)
GEOGRAPHIC LOCATION
OF ALL THE ASSETS OF THE PORTFOLIO
Management Report /
Property Report
116
/


