


 136 / 236

140
160
120
100
80
60
31.12.2005 31.12.2006 31.12.2007
31.12.2008 31.12.2009 31.12.2010
31.12.2011
31.12.2012
31.12.2013
31.12.2014
31.12.2015
150
200
100
50
0
31.12.2005 31.12.2006 31.12.2007
31.12.2008
31.12.2015
31.12.2009 31.12.2010
31.12.2011
31.12.2012
31.12.2013
31.12.2014
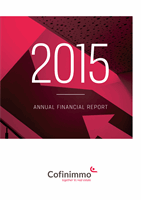
The graph below shows the market price of the Cofinimmo share in relation to its intrinsic value (in fair value) over the last 10 years. The share
shows an average premium of 1.3% over 10 years and an average premium of 15.9% over 2015.
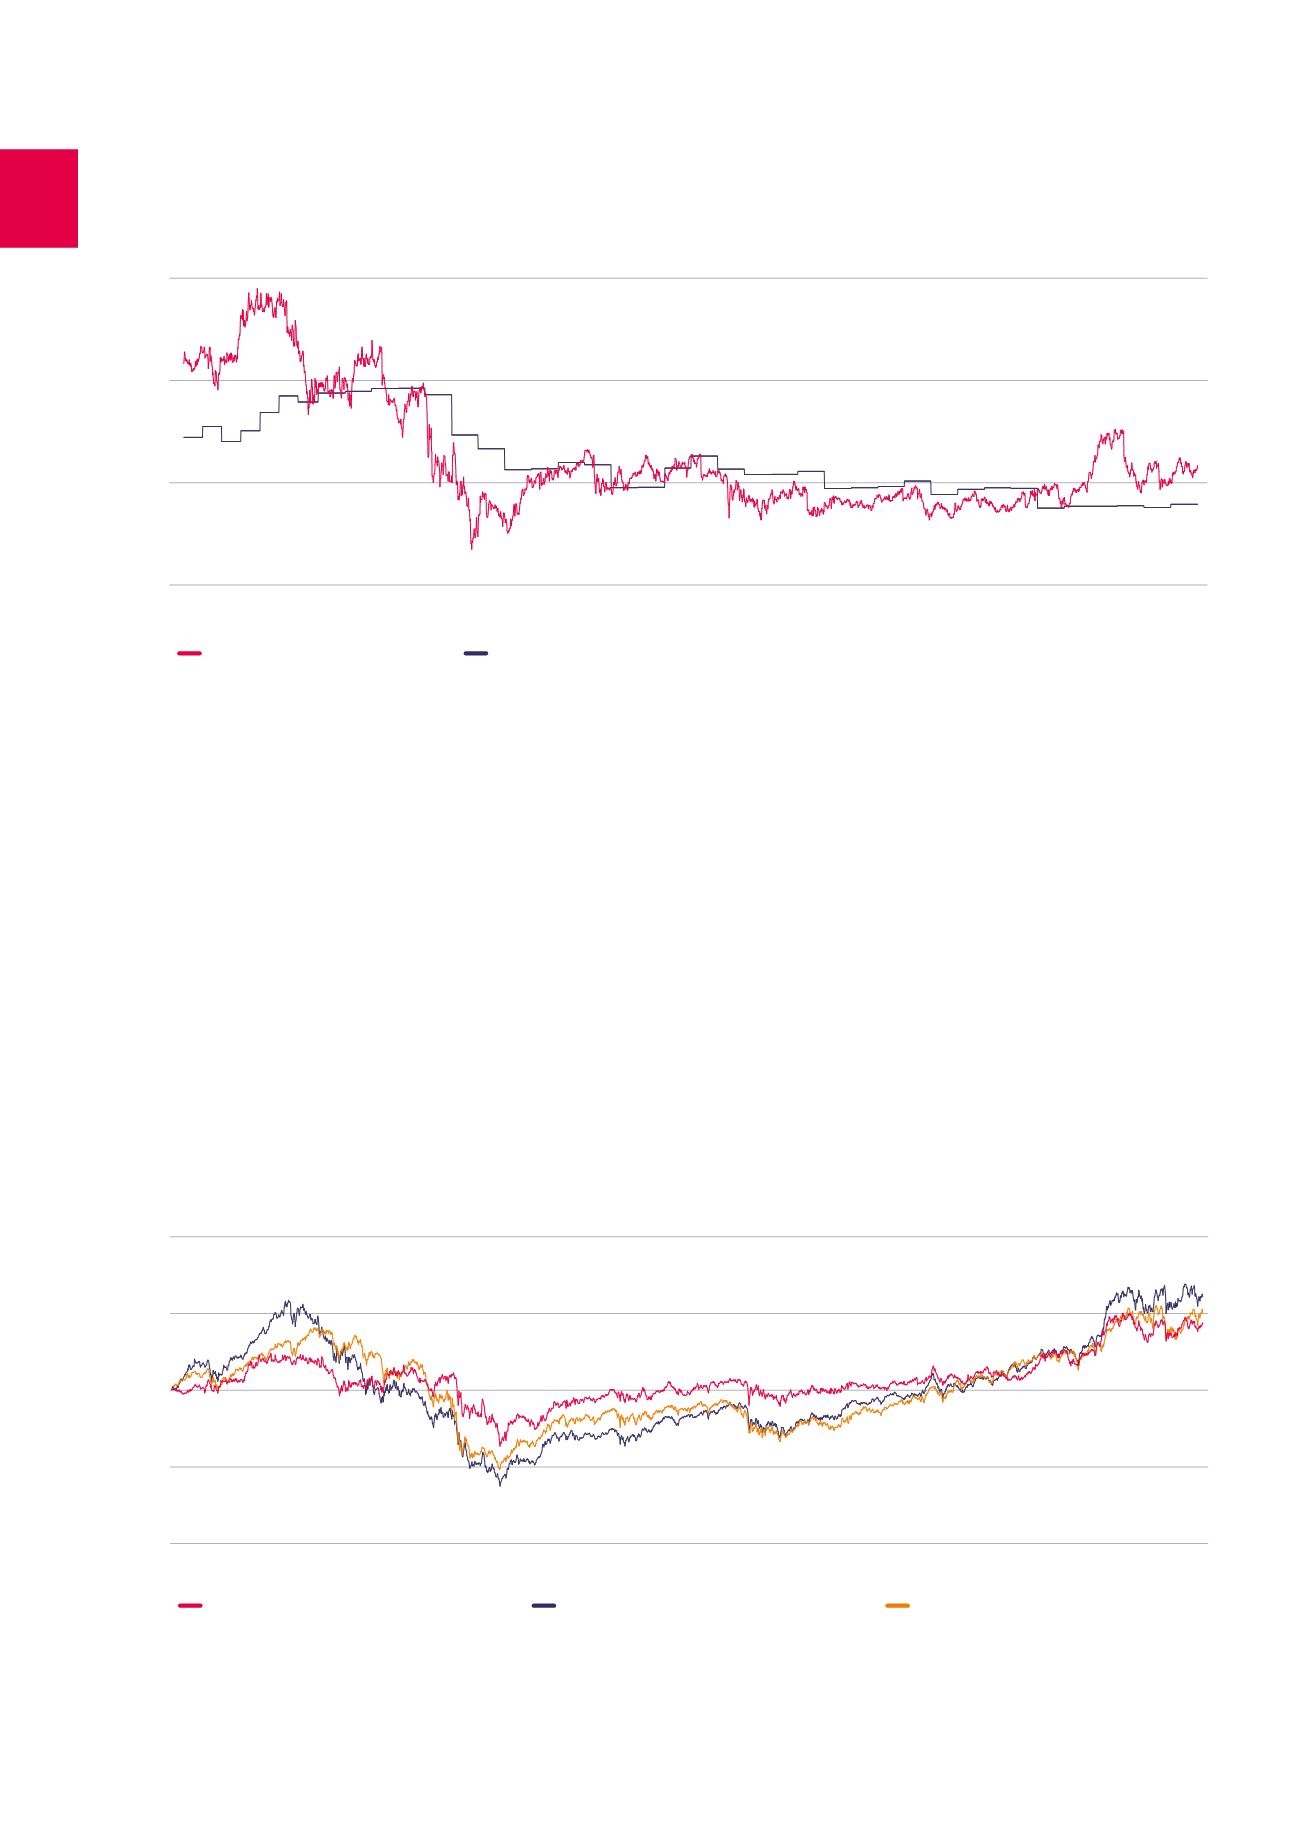
Total return (in %)
The total return for the shareholder is measured by reference to
the evolution of the share price and includes the distribution of the
dividend or any other distribution realised or paid by the company.
Assuming the reinvestment of the 2014 dividend made available for
payment in June 2015, the Cofinimmo share posted a total return of
11.2% over 2015.
The graph below illustrates the stock market performances of the
Cofinimmo share compared with the BEL20 and EPRA Europe indexes
over the past 10 years, dividend return included. During this period,
the Cofinimmo share generated a total return of 43.1%, i.e. an annual
average return of 4.3%. The BEL20 and EPRA Europe indexes posted
total variations of 50.6% and 61.0% respectively, which corresponds to
average annual yields of 5.1% and 6.1%.
Comparison of share price vs. revalued net assets per share (in EUR)
Cofinimmo share price
Net asset value (in fair value)
Total yields (base 100 at 31.12.2005)
Cofinimmo total yield
EPRA Europe index total yield
BEL20 index total yield
132
Cofinimmo on the stock market /
ORDINARY SHARE