


 16 / 220

10
/
Management Report
/ Key Figures
KEY FIGURES
MANAGEMENT REPORT
Global information
(x€1,000,000)
31.12.2013
31.12.2012
Portfolio of investment properties (in fair value)
3,347.0
3,308.6
(x€1,000)
31.12.2013
31.12.2012
Property result
216,909
222,373
Operating result before result on the portfolio
185,619
188,839
Financial result
-74,935
-83,877
Net current result (Group share)
104,924
97,486
Result on the portfolio (Group share)
-46,187
586
Net result (Group share)
58,737
98,072
(in %)
31.12.2013
31.12.2012
Operating costs/average value of the portfolio under management
1
0.83%
0.87%
Operating margin
85.57%
84.92%
Weighted residual lease term
2
(in years)
11.6
11.7
Occupancy rate
3
95.43%
95.71%
Gross rental yield at 100% occupancy
7.03%
7.01%
Net rental yield at 100% occupancy
6.55%
6.55%
Average interest rate on borrowings
4
3.92%
4.11%
5
Debt ratio
6
48.87%
49.90%
Loan-to-value ratio
7
49.61%
51.21%
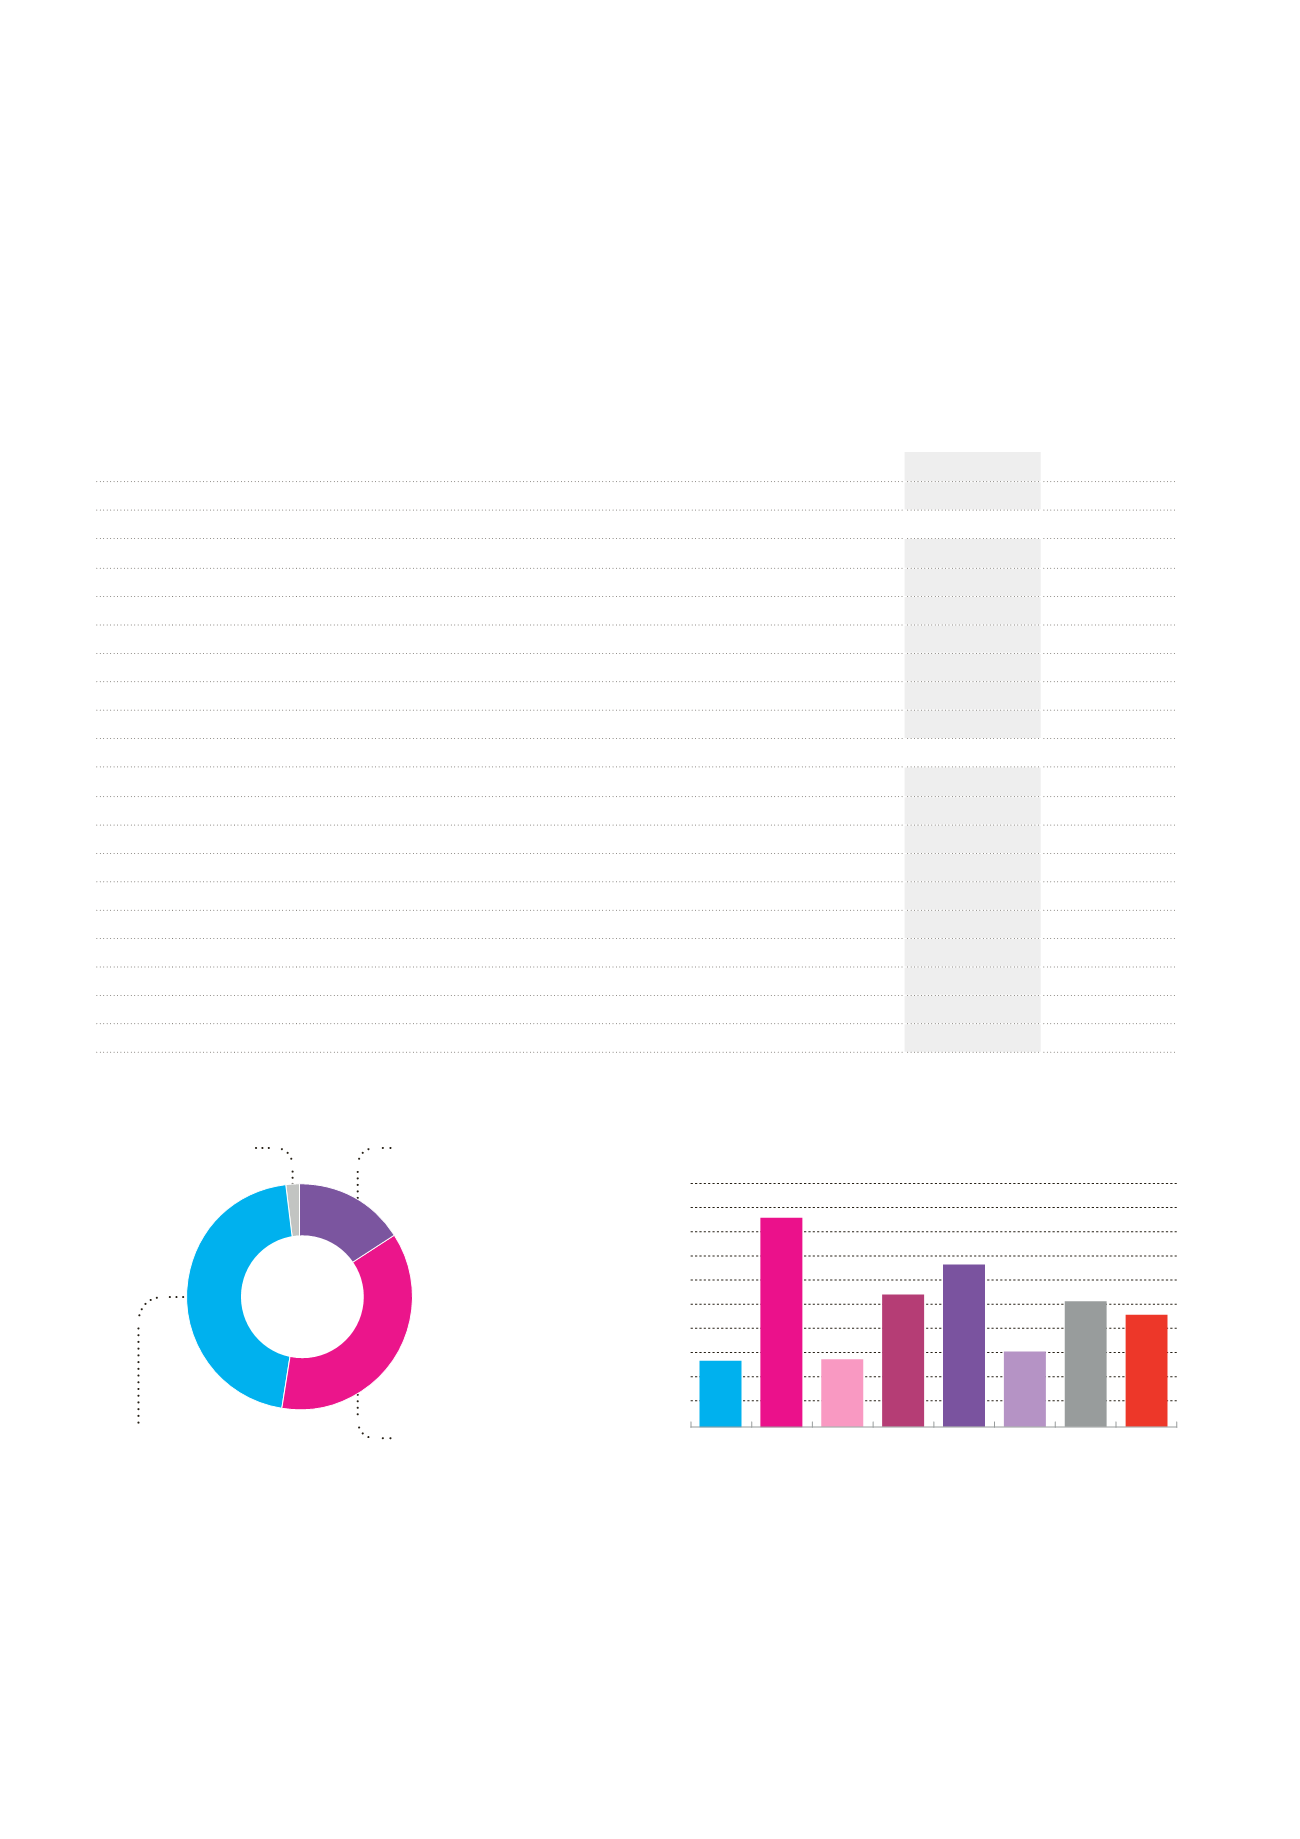
Healthcare real estate 36.7%
Offices 45.6%
Property of distribution
networks 15.9%
Other 1.8%
Breakdown of the portfolio in fair value
(in %)
Weighed residual lease length per segment
(in years)
2
6.9
21.7
7.0
13.7
16.8
7.8
13.0 11.6
Offices Healthcare
real estate
Belgium
Healthcare
real estate
France
Healthcare
real estate
Netherlands
Cafés/
restaurants
(Pubstone)
Insurance
agancies
(Cofinimur I)
Other
Global
portfolio
1
Average value of the portfolio plus the value of sold receivables relating to buildings which maintenance costs payable by the owner are still met by the Group through total cover
insurance premiums.
2
Up until the date of the tenant’s first break option.
3
Calculated according to actual rents and the estimated rental value for unoccupied buildings.
4
Including bank margins.
5
Until the end of 2012, the calculation of the average interest rate on borrowings included the depreciation costs of hedging instruments pertaining to the period. As a result of the
restructuration of the hedging scheme during 2013, the method used for the calculation of the average interest rate on borrowings has been reviewed and no longer includes these
costs. If this calculation method had been applied at 31.12.2012, the average interest rate on borrowings would have stood at 3.77% instead of 4.11%.
6
Legal ratio calculated in accordance with the legislation regarding Sicafis/Bevaks as financial and other debts divided by total assets. In accordance with Article54 of the Royal Decree
of 07.12.2010, where the debt ratio exceeds 50%, Cofinimmo must draw up a financial plan accompanied by an execution schedule detailing the measures taken to prevent this debt
ratio exceeding 65% of the consolidated assets. See Note23, section D.
7
Ratio calculated as the net financial debt divided by the sum of the fair value of the portfolio and the finance lease receivables.
25
20
15
10
5
0