


 17 / 220

84
88
92
96
100
\ 11
Key Figures \
Management Report
1
Ordinary and preference shares.
2
Takes into account the disposal, in January2013, of 8,000 treasury shares.
3
This consists mainly of the changes in fair value of investment properties and the impact of the impairment test on the goodwill.
4
Fair value: after deduction of transactions costs (mainly transfer taxes) from the value of investment properties.
5
Investment value: before deduction of transactions costs (mainly transfer taxes) from the value of investment properties.
6
By assuming the theoretical conversion of the convertible bonds issued by Cofinimmo, the mandatory convertible bonds issued by Cofinimur I and the stock options.
7
These data are not compulsory according to the Sicafi/Bevak regulation and are not subject to verification by public authorities. The auditor verified whether the EPRA Earnings, EPRA
NAV, EPRA NNNAV and EPRA cost ratios are calculated according to the definitions included in the 2013 “EPRA Best Practices Recommendations” and if the financial data used in the
calculation of these figures comply with the accounting data included in the audited consolidated financial statements.
8
Source: CBRE.
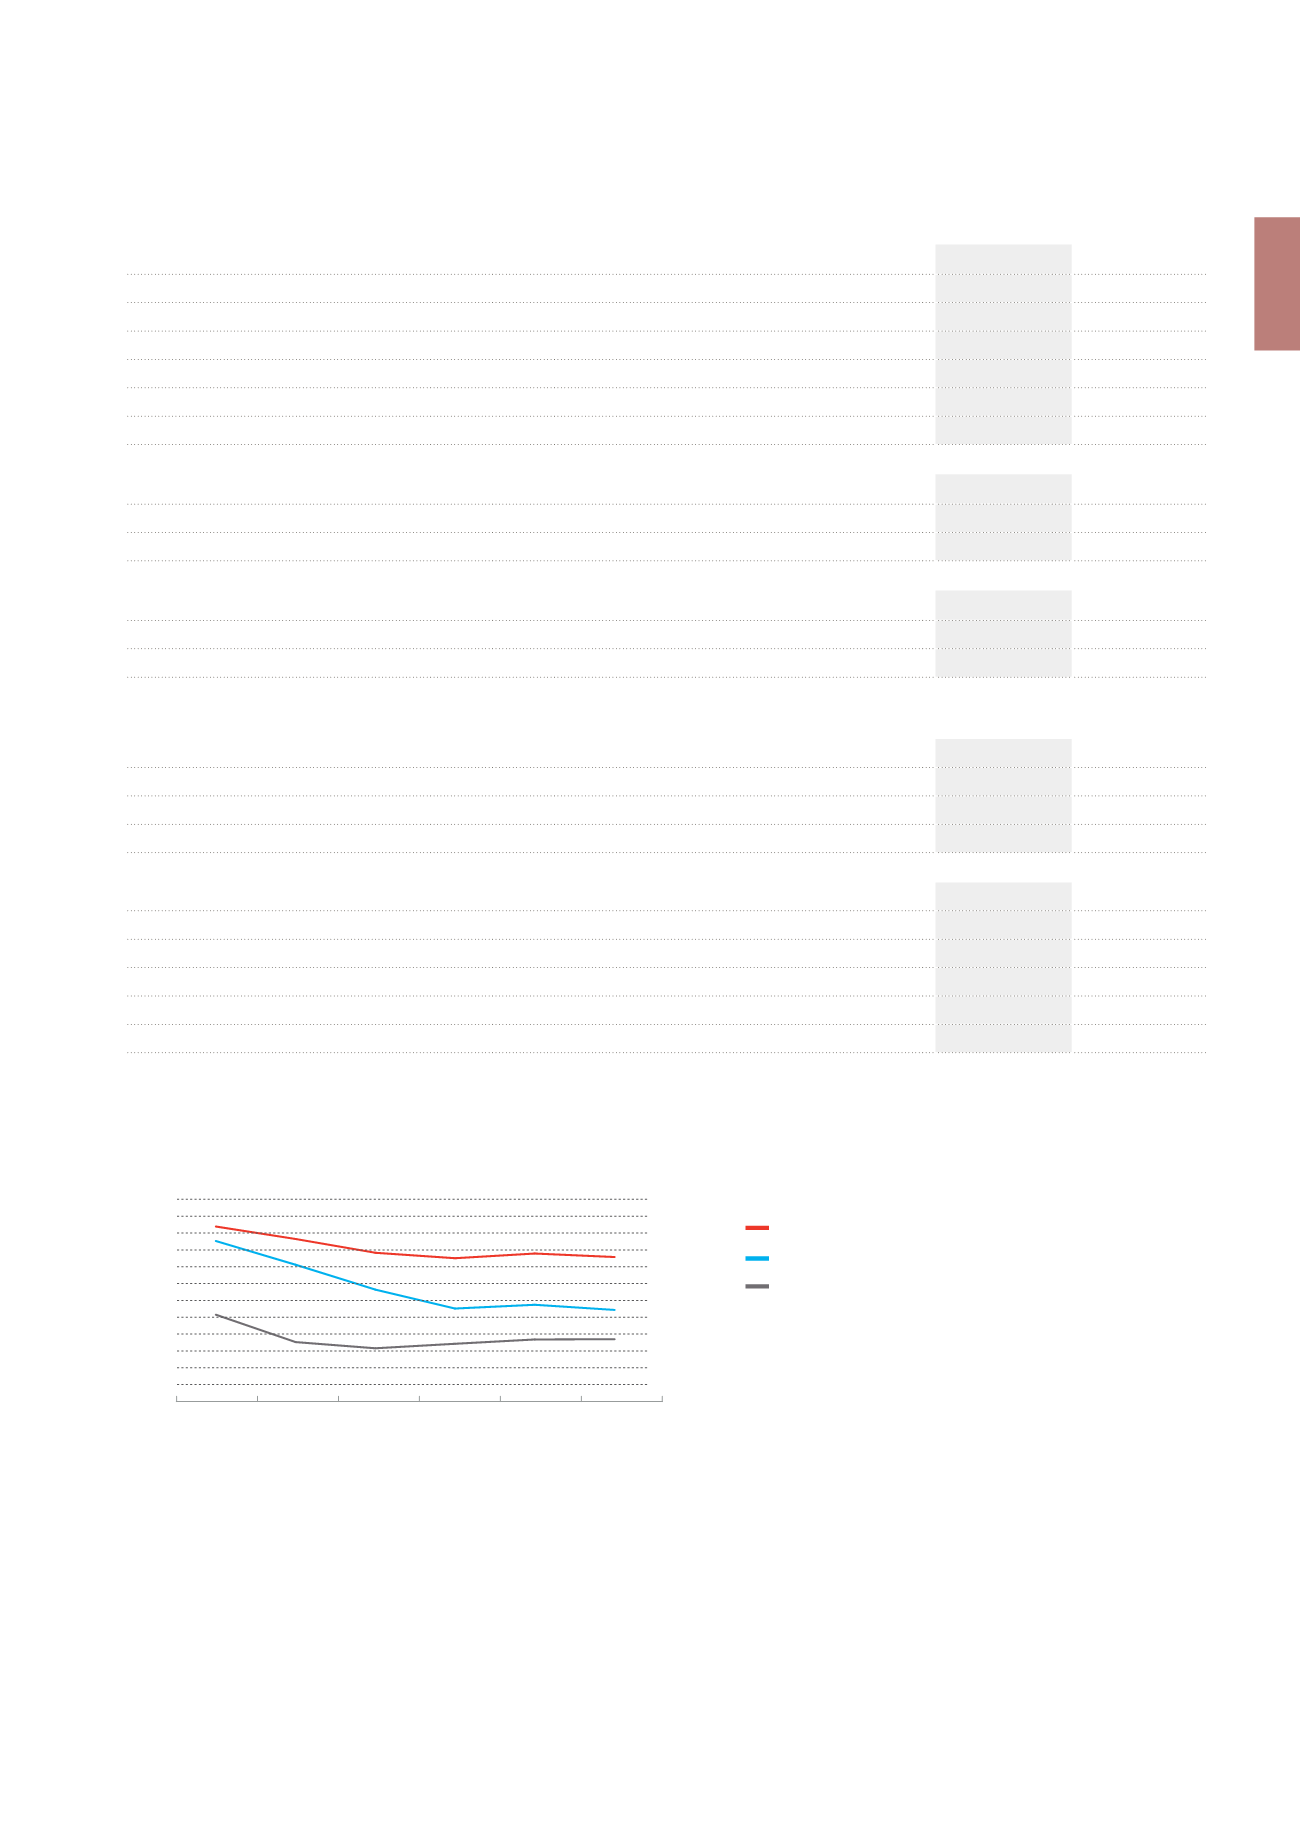
Evolution of the occupancy rate of the Cofinimmo portfolio
vs. the Brussels office market
(in %)
Cofinimmo - Global portfolio
Cofinimmo - Offices
Market – Offices – Brussels
2008
2009
2010
2011
2012
2013
95.43%
91.24%
88.92%
8
100
96
92
88
84
Figures per share
1
(in €)
Results per share
31.12.2013
31.12.2012
2
Net current result – Group share – excluding IAS39 impact
6.78
7.61
IAS39 impact
-0.82
-1.52
Net current result – Group share
5.96
6.09
Realised result on the portfolio
-0.02
0.02
Unrealised result on the portfolio
3
-2.60
0.01
Net result – Group share
3.34
6.12
Net Asset Value per share
31.12.2013
31.12.2012
2
Revalued Net Asset Value in fair value
4
after distribution of the dividend for the year 2012
91.79
85.66
Revalued Net Asset Value in investment value
5
after distribution of the dividend for the year 2012
96.26
90.31
Diluted Net Asset Value per share
6
31.12.2013
31.12.2012
2
Diluted revalued Net Asset Value in fair value
4
after distribution of dividend for the year 2012
95.74
88.23
Diluted revalued Net Asset Value in investment value
5
after distribution of dividend for the year 2012
99.55
92.35
EPRA performance indicators
7
(in € per share)
31.12.2013
31.12.2012
2
EPRA Earnings
6.78
7.61
2
EPRA Net Asset Value (NAV)
98.85
102.04
2
EPRA Adjusted Net Asset Value (NNNAV)
95.74
94.38
2
(in %)
31.12.2013
31.12.2012
EPRA Net Initial Yield (NIY)
6.20%
6.19%
EPRA “Topped-up” NIY
6.16%
6.10%
EPRA Vacancy rate
5.04%
4.70%
EPRA Cost ratio (direct vacancy costs included)
18.87%
18.69%
EPRA Cost ratio (direct vacancy costs excluded)
16.01%
16.17%