


 75 / 222

1
See also our press release dated 12.06.2014, available on
www.cofinimmo.com.In 2014, Cofinimmo raised equity for €32 million through
the distribution of dividends in shares.
Capital markets
Cofinimmo regularly has access to capital markets to finance its investment projects. At 31.12.2014, the funds raised on the capital markets
were made up of:
•
€190 million in the form of non-convertible bonds ;
•
€381.4 million in the form of convertible bonds ;
Following the 2013 dividend distribution of €6.00 per ordinary share, the rights of the holders of convertible bonds issued in 2013 have
been adjusted
1
. Hence, as of 06.06.2014 (settlement date of the 2013 dividend), the conversion price of these bonds stands at €104.231.
Issuer
Par value
(x €1,000,000)
Issue price
Coupon
Issue date
Maturity date
Cofinimmo SA/NV
€140.0
100%
3.598%
26.07.2012
07.02.2020
Cofinimmo SA/NV
€50.0
100%
2.78%
23.10.2013
23.10.2017
Issuer
Par value
(x €1,000,000
Issue price Conversion price
Coupon
Issue date
Maturity date
Cofinimmo SA/NV
€173.3
100%
€116.60
3.125%
28.04.2011
28.04.2016
Cofinimmo SA/NV
€190.8
100%
€104.231
2.00%
20.06.2013
20.06.2018
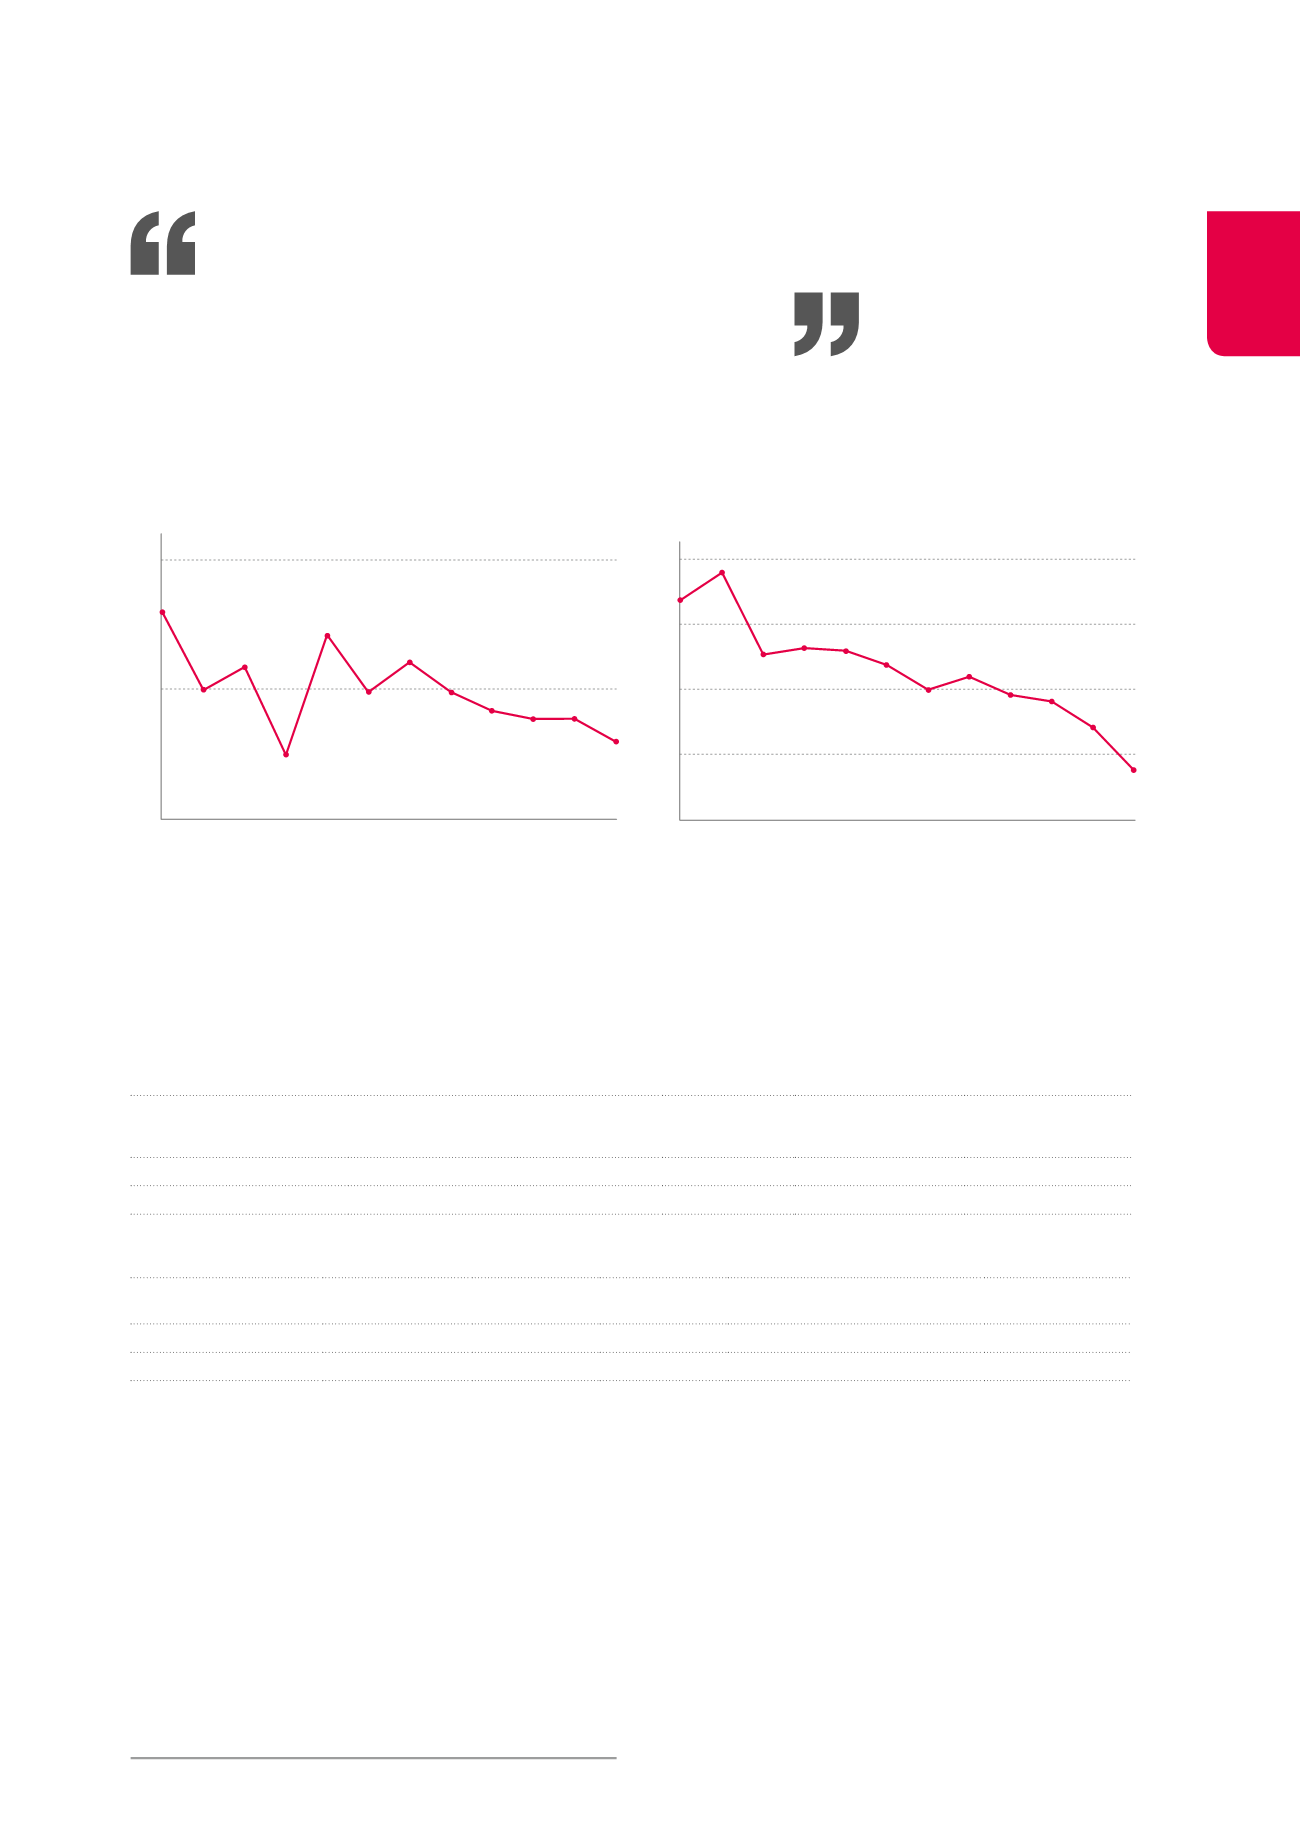
55%
50%
45%
06/2009
12/2009
06/2010
12/2010
06/2011
12/2011
06/2012
12/2012
06/2013
12/2013
06/2014
12/2014
Evolution of the debt ratio (half-yearly)
5%
4.5%
4%
3.5%
3%
06/2009
12/2009
06/2010
12/2010
06/2011
12/2011
06/2012
12/2012
06/2013
12/2013
06/2014
12/2014
Evolution of the average cost of debt (in %)
48.01%
3.39%
4.91%
4.70%
4.33%
4.20%
4.11%
3.92%
52.94%
49.97%
47.50%
49.89% 49.90%
48.87%
71