


 35 / 222

-0.11%
1
Including the impact of the investment expenditures capitalised during the year.
2
For the office portfolio alone, it stands at 4.8 years.
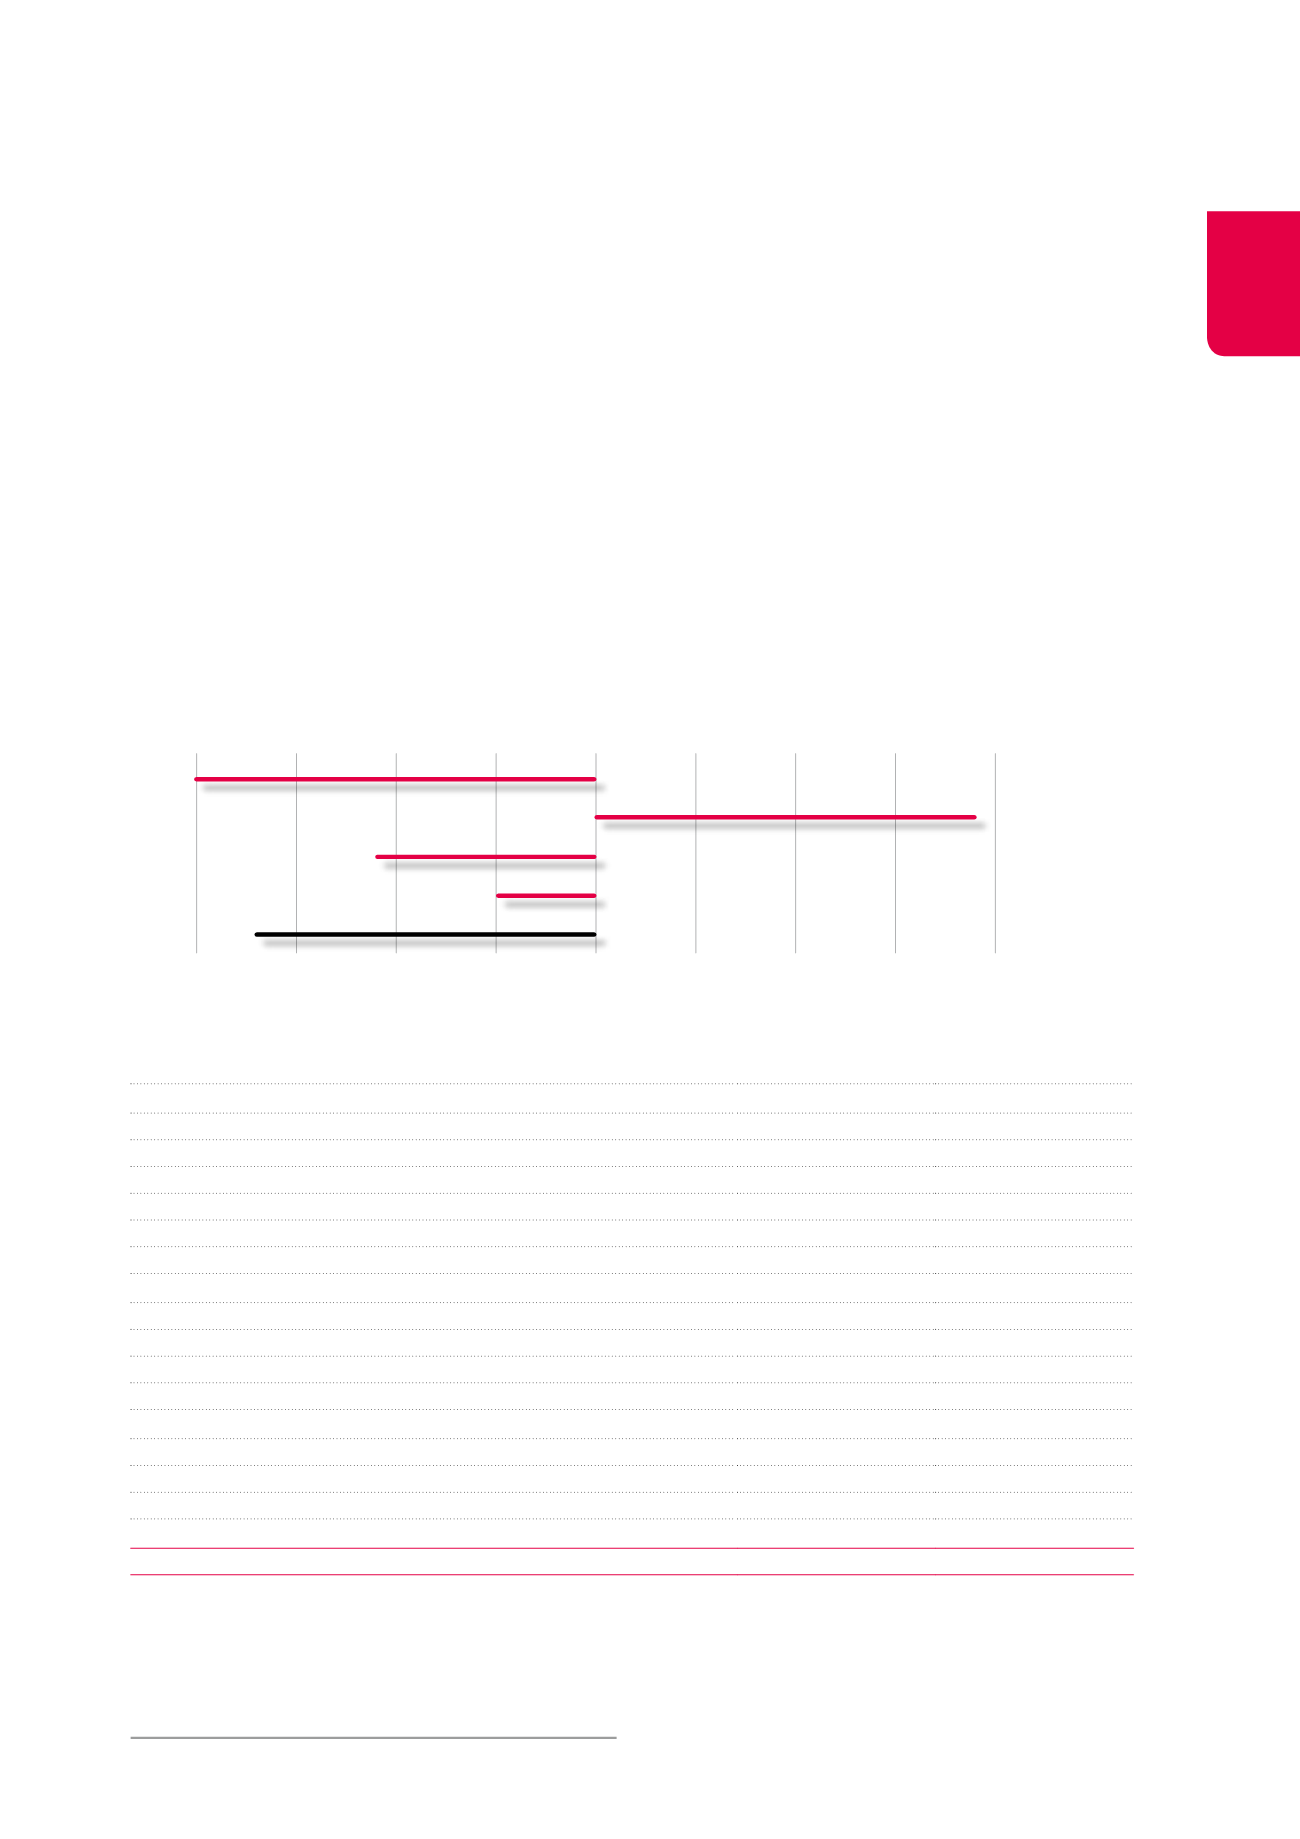
Changes in the fair value of investment properties (in %)
-0.20%
-0.05%
-0.17
%
0.19%
-0.20%
-0.10%
0
0.10%
0.20%
Q1
Q2
Q3
Q4
Total
Changes in the fair value of the
portfolio
The Cofinimmo portfolio records a decrease in fair value of -0.17%
1
over the 12 months of 2014, which corresponds to €-5.5 million. The
change in fair value of the portfolio was positive during the second
quarter of 2014, thanks namely to the delivery of the works on the
Livingstone II office building.
This depreciation is made up as follows:
•
the segments “Offices” and “Property of distribution networks“
record a negative change in fair value of €-17.8 million and
€-1.2 million respectively;
•
the segments “Healthcare real estate” and “Other” record a
positive change in fair value of €10.1 million and €3.4 million
respectively.
The depreciation of the office portfolio comes from buildings under
renovation or requiring a significant renovation in the short term.
This is the case for the Belliard 40, Souverain/Vorst 23-25, Arts/
Kunsten 19H, and Guimard 10-12 buildings.
At the global portfolio level, this depreciation is partially compen-
sated by:
•
the indexation of the leases;
•
a high occupancy rate: 95.19% at 31.12.2014;
•
an average residual lease length which has increased from
6.7 years at the end of 2004, to 8.4 years at the end of 2006,
and then to 11.0 years
2
at the end of 2014, an outstanding figure
among the European real estate companies.
Segment
Change in fair value
over the year
Breakdown by geography
and by segment
Offices
-1.34%
41.01%
Antwerp
1.84%
2.04%
Brussels Centre/North
3.12%
3.48%
Brussels Decentralised
-5.42%
17.65%
Brussels Leopold/Louise
3.41%
9.86%
Brussels Periphery & Satellites
-1.21%
4.44%
Other
1.19%
3.54%
Healthcare real estate
0.79%
40.29%
Belgium
0.80%
25.67%
France
0.26%
11.86%
Germany
8.25%
0.36%
Netherlands
2.36%
2.40%
Property of distribution networks
-0.22%
16.68%
Pubstone - Belgium
-0.19%
8.51%
Pubstone - Netherlands
-1.26%
4.67%
Cofinimur I - France
1.11%
3.50%
Other
5.60%
2.02%
TOTAL
-0.17%
100%
31