


 37 / 222

Occupancy rate and rental vacancy
The rental vacancy risk faced by Cofinimmo each year represents
on average 5% of its overall portfolio and 10% to 15% of its office
portfolio alone. The letting team pays special attention to the clients
whose leases are considered at risk. The treatment of the rental
vacancy risk in 2014 shows that 67% was secured through renego-
tiations, unexercised breaks and lease renewals. This percentage
of tenant retention reaches 72% if the new leases that were signed
and took effect during the year are also taken into account. Hence,
of the 5% of the total portfolio that were at risk in 2014, 3.6% have
been secured.
During the financial year 2014, Cofinimmo signed leases for over
54,400m² of office space, representing contractually guaranteed
revenues, net of rent-free periods, of €58.4 million
1
. The most impor-
tant transactions are related to the Livingstone II, Arts/Kunsten
47-49, Woluwe 102, Leuvensesteenweg 325, Souverain/Vorst 36 and
Bourget 44 buildings.
On a like-for-like basis, the rental revenues increased by 1.02% in
2014.
Three elements help to maintain a positive reversion:
•
the office occupancy rate
3
, which is still relatively high
(90.35%);
•
the tenant rotation rate over the entire portfolio, which remains
limited at 2%;
•
healthcare real estate and property of distribution networks
have leases which are indexed positively and rents which are
protected by their long duration.
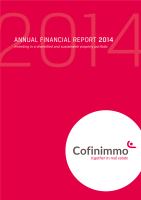
Vacancy risk handling (in %)
2010
2011
2012
2013
2014
100
90
80
70
60
50
40
30
20
10
0
67%
5%
28%
15%
52%
Evolution of rental revenues on a like-for-like basis 2014 vs.
2013 (in %)
0
1
2
3
1.0%
0.2%
2.4%
1.6%
1.1%
1.0
%
1.0%
Offices
Healthcare real estate
Belgium
Healthcare real estate
France
Healthcare real estate
Netherlands
Property of distribution
networks
Other
Global portfolio
1
Spread over the fixed length of the new or renegotiated lease agreements.
2
The renegociations of lease contracts were made at less favourable conditions
than the previous contracts for the same premises.
3
The occupancy rate is calculated by dividing the contractual rents of the current
leases (indexed) by the sum of these contractual rents and the estimated rental
values of the vacant premises, the latter being calculated on the basis of the
prevailing market rents.
4
Source: CBRE.
The occupancy rate of the office portfolio (90.35%) is still above
the market average which stands at 89.37%
4
. This is the result
of the letting strategy based on the relationship of trust with the
clients, leading to a favourable evolution of the operating margin.
Furthermore, the diversification in the healthcare real estate sector
and the Pubstone and Cofinimur I portfolios, where the occu-
pancy rate is close to 100%, has a positive impact on the overall
occupancy rate, which stands at 95.19%, and improves the risk
distribution.
Unexercised breaks
Renegociations
2
New lettings
Effective departures
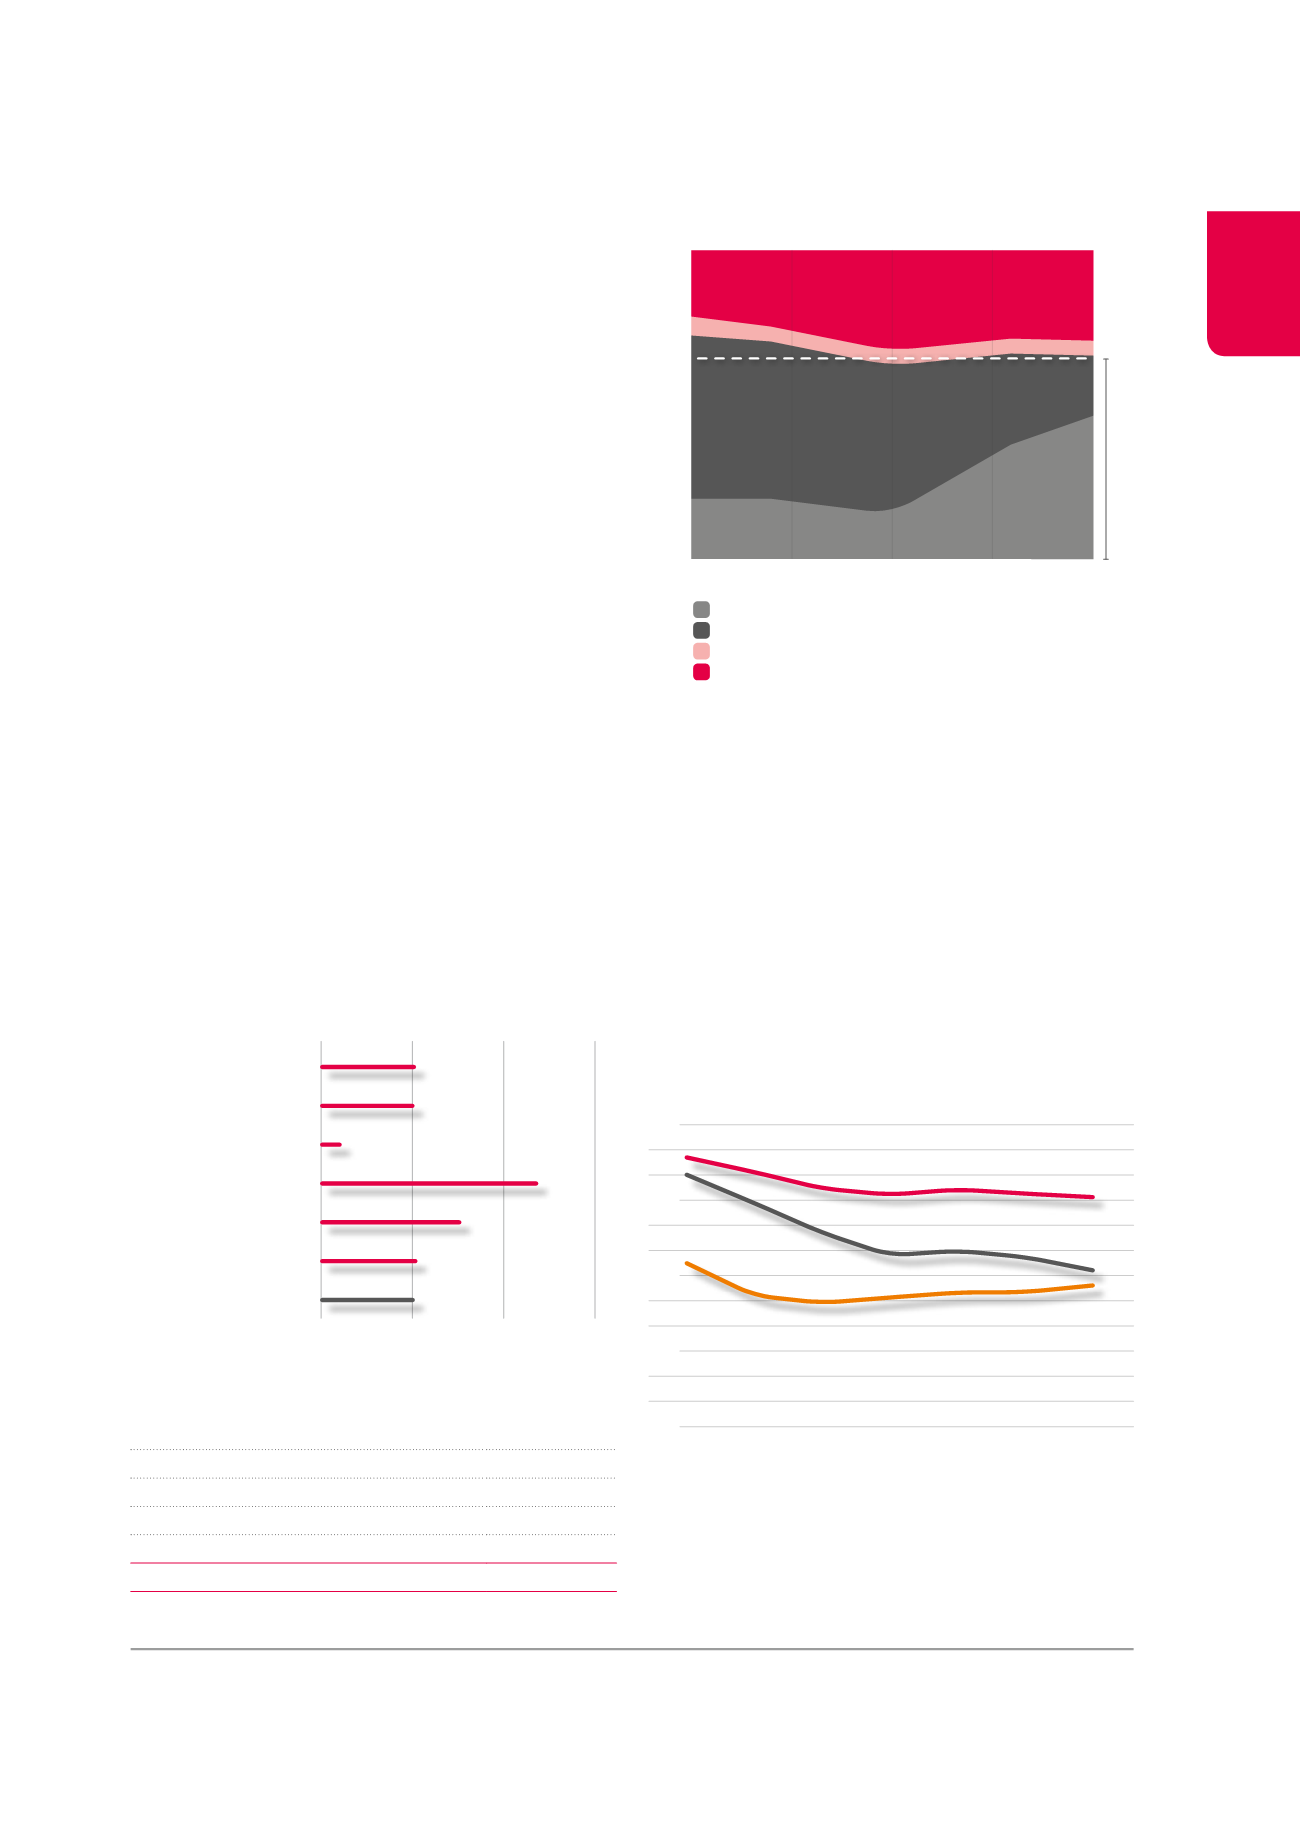
100
95
90
85
80
2008
2009
2010
2011
2012
2013
2014
Cofinimmo
Global portfolio
95.19%
Cofinimmo
Offices
90.35%
Brussels office
market
89.37%
Evolution of the occupancy rate of the Cofinimmo portfolio vs.
the Cofinimmo office portfolio vs. the Brussels office market
(in %)
Occupancy rate of the portfolio (in %)
Offices
90.35%
Healthcare real estate
99.13%
Property of distribution networks
98.40%
Other
99.82%
GLOBAL PORTFOLIO
95.19%
33