


 55 / 68

\\
53
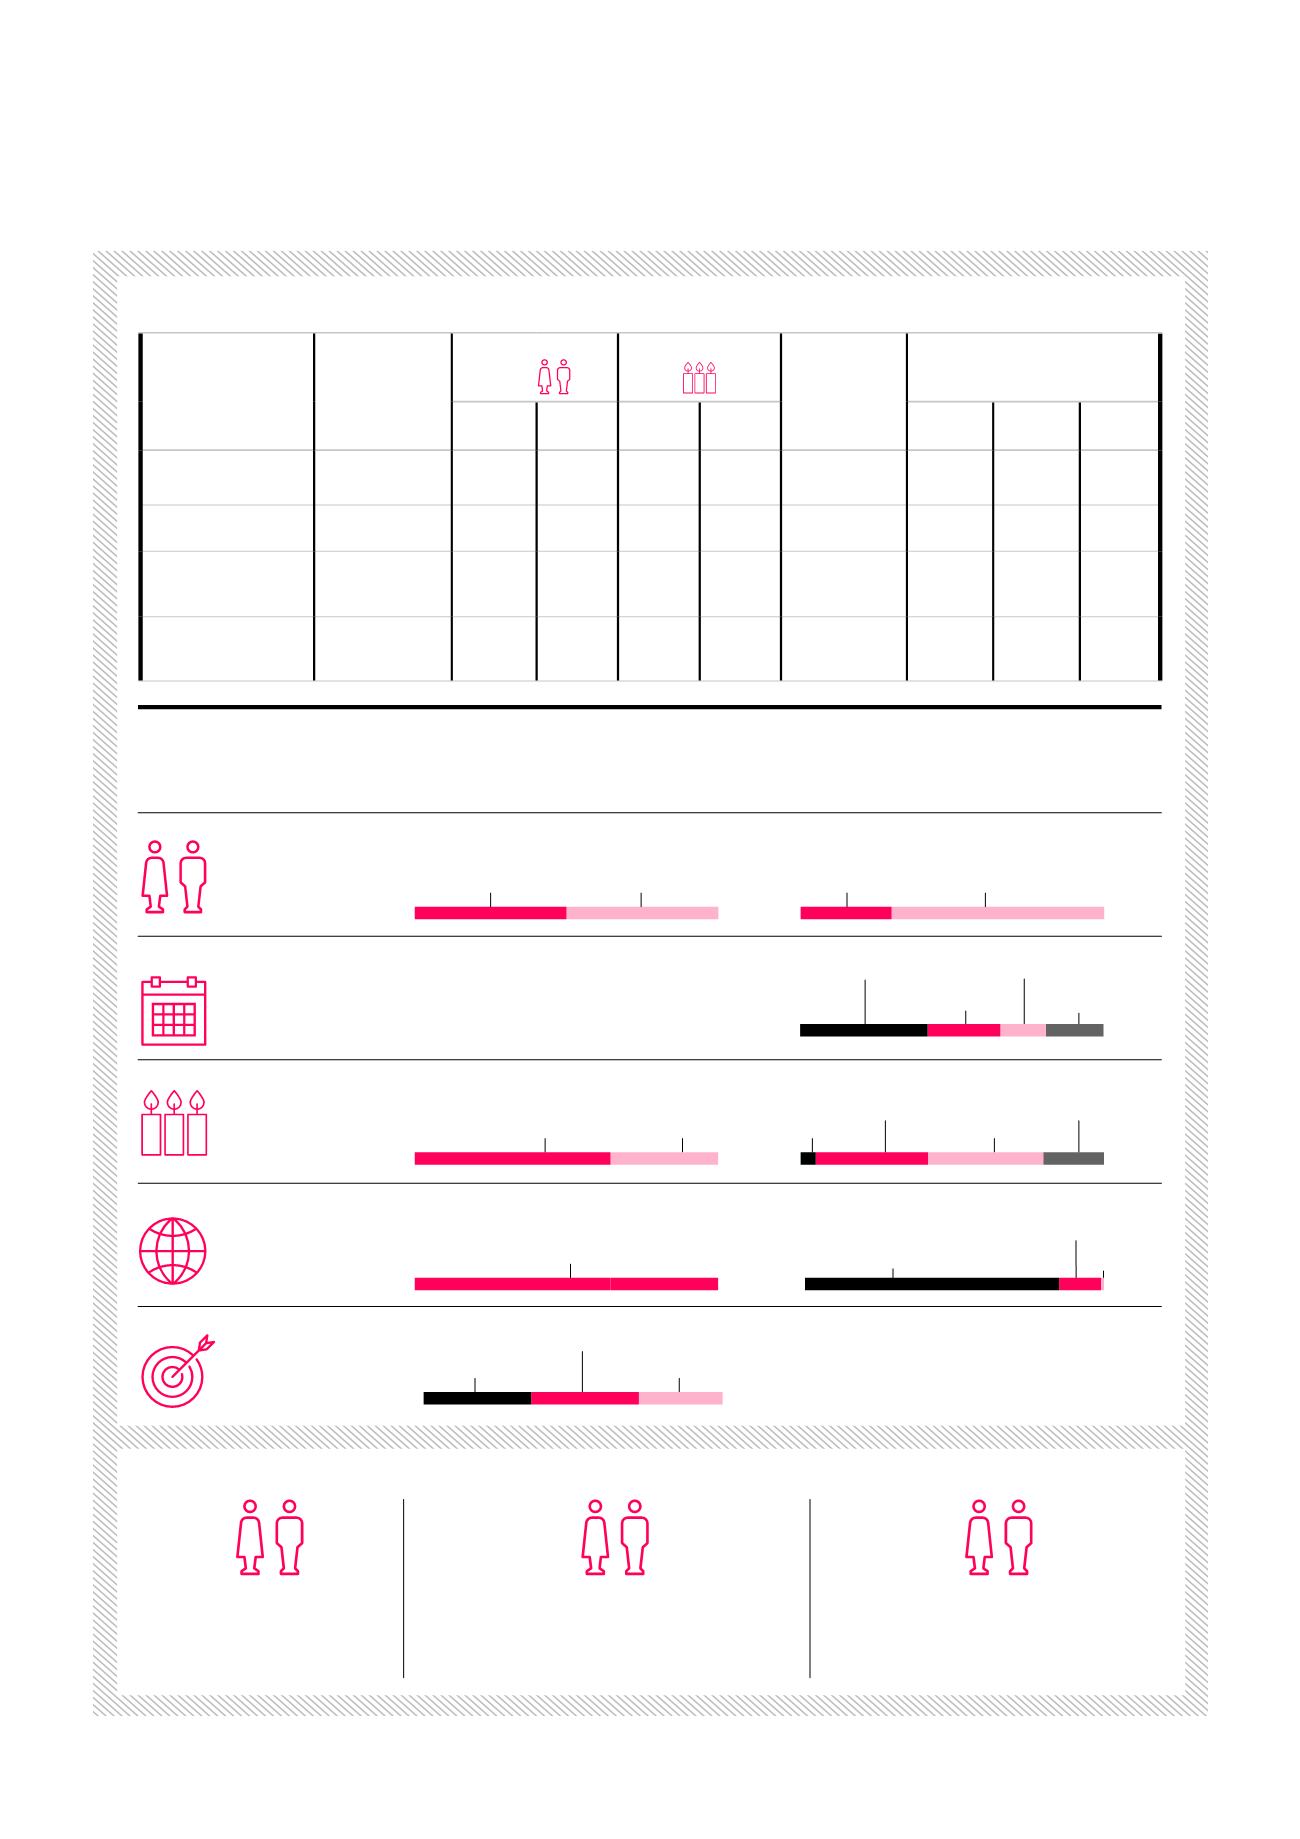
OUR 2017 PERFORMANCE INDICATORS
133
EMPLOYEES
Independent
members/total
Gender equality
in%
Age in% International-
isation
in%
Background
in%
Men Women 30-50
years
> 50
years
Financial
Real
Estate
Industrial
or other
Board of Directors
8/12
(67 %)
58%
42 % 17 % 83 % 33 % 25% 42 % 33 %
Executive
Committee
n/a
75% 25% 50% 50% 25% 25% 50% 25%
Audit Commitee
3/3
(100%)
33 % 67 % 0% 100% 33 % 67 % 33 % 0%
Nomination and
Remuneration
Committee
4/4
(100%)
75% 25% 0% 100% 50% 0% 25% 75%
50%
Men
71%
30-50 years
37%
Men
50%
Women
29%
> 50 years
63%
Women
5%
19-29 years
20%
> 50 years
37%
30-39 years
38%
40-49 years
42%
0-5 years
19%
>15 years
24%
6-10 years
15%
11-15 years
Gender equality
Seniority
Age
OUR 2018 OBJECTIVES
Continue to
improve
the M/F ratio
.
100%
Belgian
85%
Belgian
of which 8% of
non-European origin
14%
EU
1%
Outside EU
Nationality
Background
36%
Real Estate
36%
Financial
28%
Industrial or other
Focus on
recruiting young people
via our
presence at university employment days
and offering
traineeships to students
during
their studies
Assess other ways
to hire persons with
disabilities, including persons with
reducedmobility and hearing or visually
impaired persons
via specialised non-profit
associations.
14
MANAGERS