


 33 / 220

SECTOR INFORMATION
RENTAL SITUATION BY DESTINATION
PROPERTIES
Superstructure
(in m
2
)
Contractuel rents
(x €1,000)
Occupancy
rate
Rents + ERV
1
on unlet
(x €1,000)
ERV
1
(x €1,000)
Offices
519,385
78,980
88.70%
89,042
80,513
Offices of which receivables
have been sold
208,145
26,236
99.83%
26,280
26,280
Subtotal offices
727,530
105,216
91.24%
115,322
106,793
Healthcare real estate
643,755
76,585
99.27%
77,145
74,079
Pubstone (cafés/restaurants)
363,470
30,262
100.00%
30,262
27,306
Cofinimur I (insurance agencies)
59,572
7,892
98.94%
7,976
8,166
Other
23,026
4,285
100.00%
4,285
3,426
Subtotal investment properties
and properties of which
receivables have been sold
1,817,353
224,240
95.43%
234,990
219,770
Projects and renovations
36,114
345
345
Land reserve
145
145
167
GLOBAL PORTFOLIO
1,853,467
224,385
95.43%
235,480
220,282
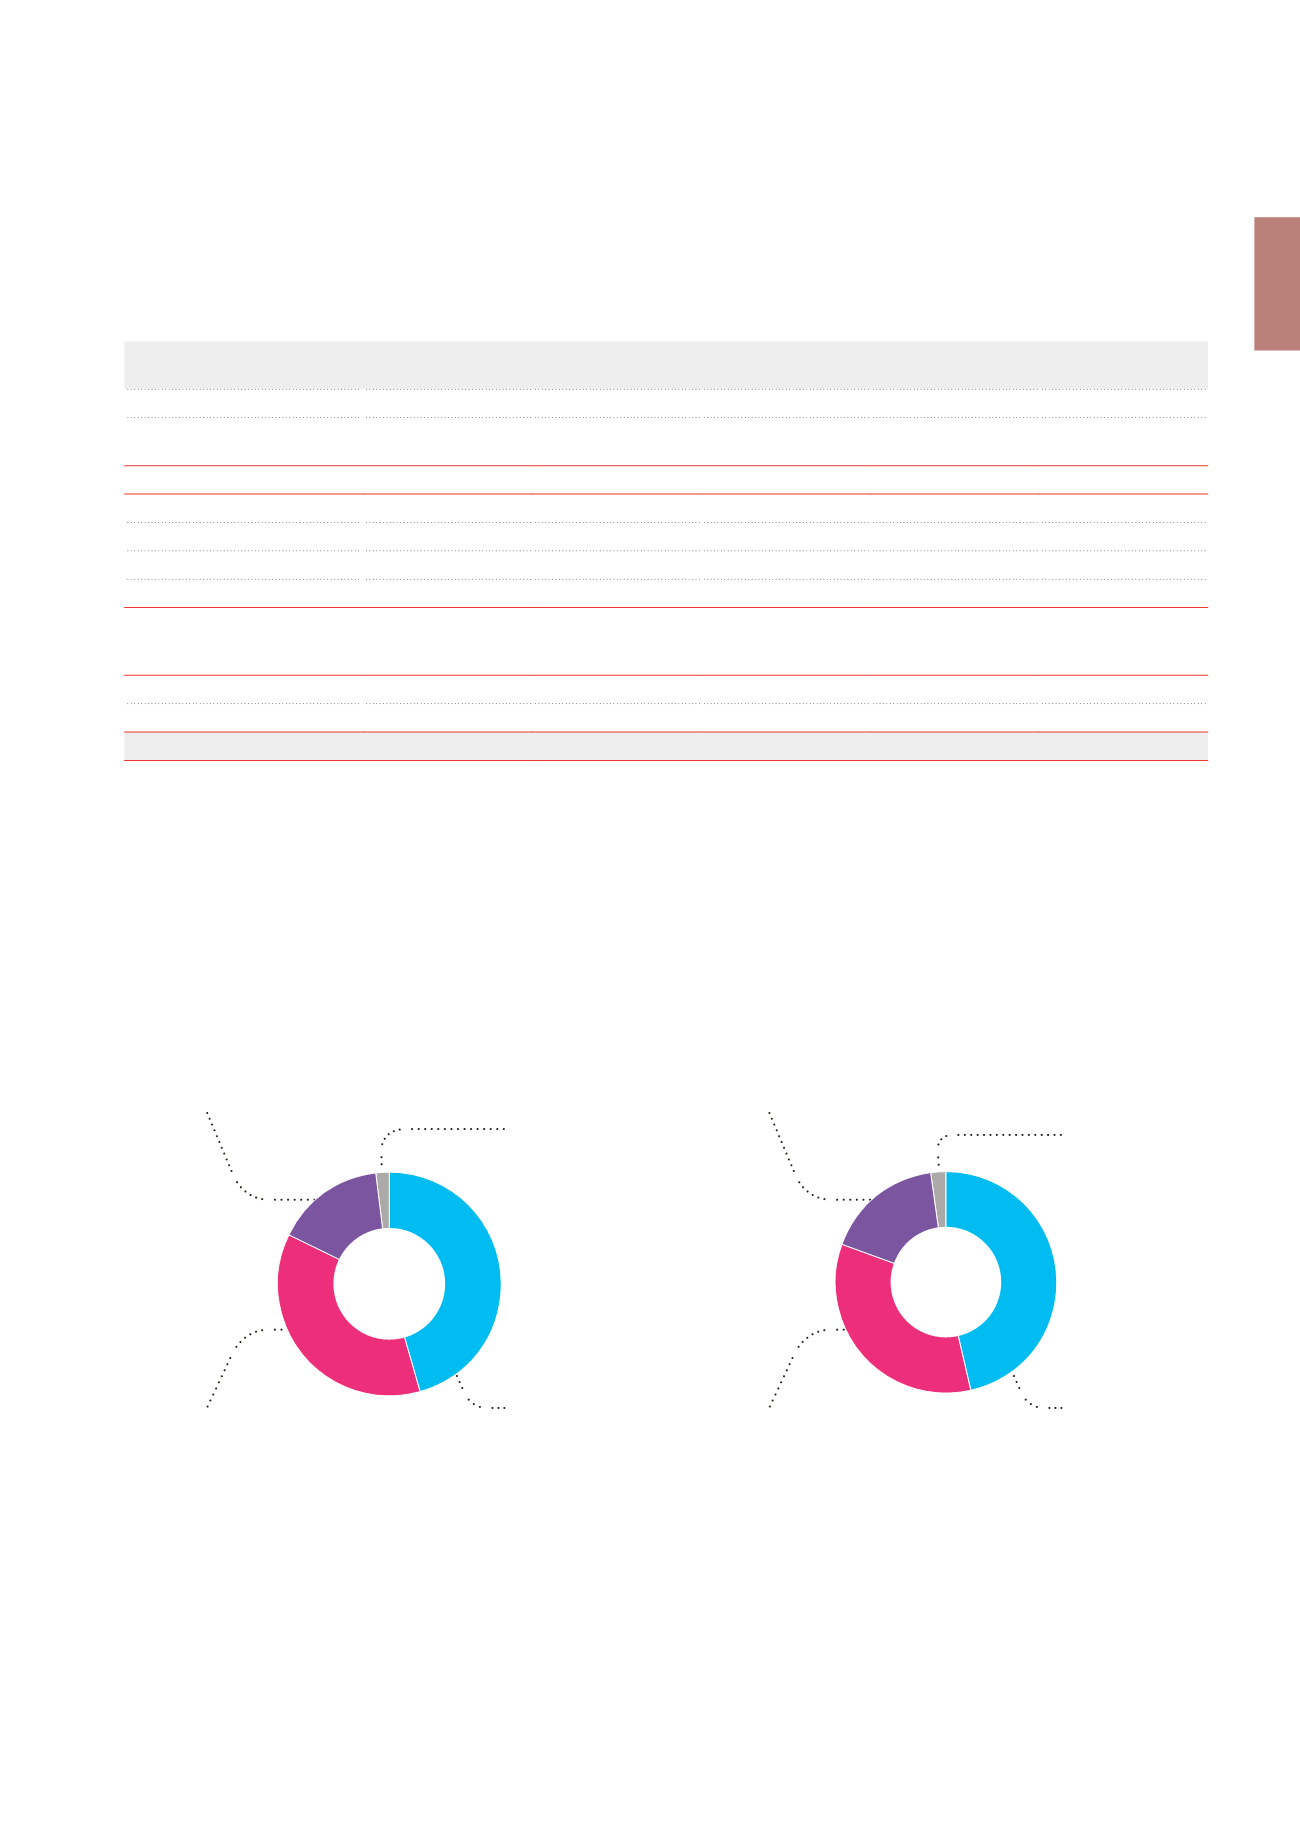
Breakdown by destination - in fair value
2
(in %)
Breakdown by destination - in collected rents
3
(x €1,000)
1
ERV = Estimated Rental Value.
2
For Cofinimmo SA/NV, the breakdown is as follows: Offices 66.1%, Healthcare real estate 31.2%, and Other 2.7%.
3
The difference between the rents actually collected and the contractual rents results from the rent-free periods granted at the beginning of certain leases and the prorata temporis
vacancy of properties during the past 12months.
Offices
45.6%
Offices
102,380
Healthcare real estate
36.7%
Healthcare real estate
75,763
Property of distribution networks
15.9%
Property of distribution networks
37,804
Other
1.8%
Other
4,515
\ 27
Global Portfolio
\ Management Report