


 30 / 220

Souverain/Vorst 23-25 – Brussels
1
Spread over the firm length of the new or renegotiated lease agreements.
2
The occupancy rate is calculated by dividing the contractual rents of the current leases (indexed) by the sum of these contractual rents and the estimated rental values of the vacant
premises, the latter being calculated on the basis of the prevailing market rents.
3
Source: CBRE.
4
The renegociations of rental agreements were done at less favourable conditions than the previous agreements.
2009
2010
2011
2012
2013
100
90
80
70
60
50
40
30
20
10
0
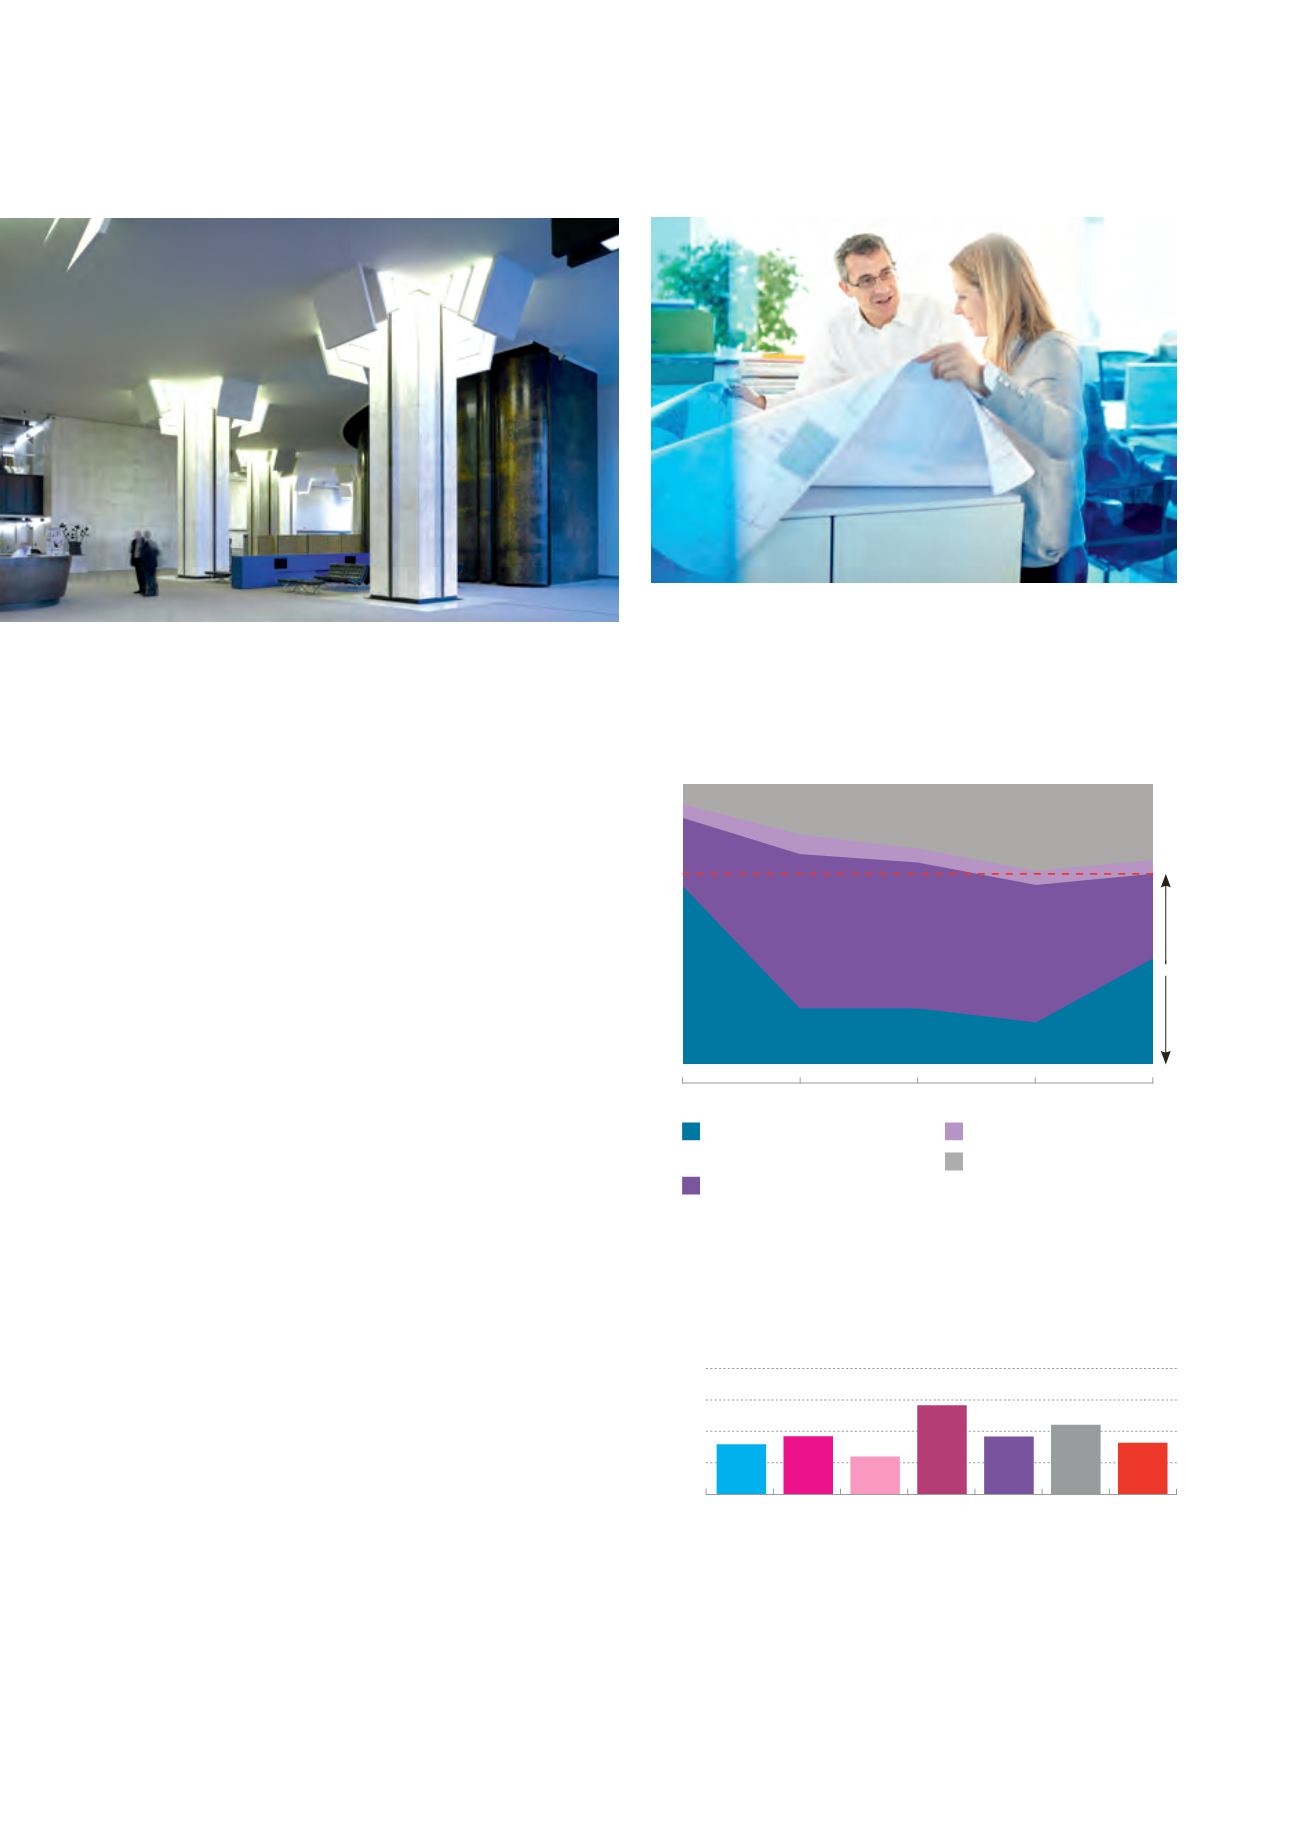
38%
30%
27%
5%
68%
Vacancy risk handling
(in %)
Unexercised resignations or
renewed leases
Renegotiations
4
New leases
Effective departures
COMMERCIAL RESULTS
The rental vacancy risk faced by Cofinimmo each year represents on aver-
age 6% of its overall portfolio and 12% to 15% of its office portfolio alone.
The letting team pays special attention to the clients whose leases are
considered at risk. The treatment of the rental vacancy risk in 2013 shows
that 68% were secured through renegotiations, unexercised resignations
and lease renewals. This percentage of tenant retention reaches 73% if
the new leases that were signed and took effect during the year are also
taken into account. Hence, of the 6% of the total portfolio that were at risk
in 2013, 4.4% have been secured. During the financial year 2013, Cofinimmo
signed leases for over 66,150m² of office space, representing contractu-
ally guaranteed revenues, net of rent-free periods, of €41.8 million
1
. The
most important transactions are related to the buildings Bourget 40, 44
and 50, Guimard 10-12, Noordkustlaan 16 and Maire 19 – Tournai.
The occupancy rate
2
of the office portfolio (91.24%) is still above the
market average, which stands at 88.9%
3
. This confirms the success
of Cofinimmo’s commercial strategy, geared to forging a close relation-
ship of trust with the clients and serving to boost the operating margin.
Furthermore, the diversification in the healthcare real estate sector and
the Pubstone and Cofinimur I portfolios, for which the occupancy rate is
nearly 100%, has a positive impact on the overall occupancy rate, which
stands at 95.43%, and improves the spread of the risk.
On a like-for-like basis, the rental revenues increased by 1.68% in 2013.
Evolution of rental revenues on a like-for-like basis
2013 vs. 2012
(in %)
Offices Healthcare
real estate
Belgium
Healthcare
real estate
France
Healthcare
real estate
Netherlands
Property of
distribution
networks
Other
Global
portfolio
4
3
2
1
0
1.62% 1.88%
1.22%
2.88%
1.87% 2.25%
1.68%
24
/
Management Report /
Global Portfolio