


 29 / 220

In 2013, Cofinimmo’s divestments amounted to
€21.70 million and its investments to €62.47 million.
3,525
3,500
3,475
3,450
3,425
3,400
EVOLUTION OF THE PORTFOLIO
1
Since it obtained its Sicafi/Bevak status in 1996, the Cofinimmo Group
realised investments for a total amount of €4,150.16 million. The com-
pany also divested for a total amount of €1,655.52 million, realising
(before deduction of intermediaries’ remuneration and other various
costs) an average net gain of +9.78% compared to the last annual
valuations (in investment value) preceding these disposals. During
the year 2013 alone, this average stood at +1.4%.
ACQUISITIONS
During 2013, Cofinimmo invested a total amount of €7.85 million in new
acquisitions, of which €7.29 million in the healthcare real estate segment
and €0.56 million in the MAAF insurance agencies network.
EXTENSIONS AND REDEVELOPMENTS
Moreover, Cofinimmo invested a total amount of €41.58 million in exten-
sions and redevelopments (€40.65 million in healthcare real estate and
€0.93 million in offices).
RENOVATIONS
Cofinimmo also carried out renovations amounting to €13.05 million,
mainly in the office and the Pubstone cafés/restaurants portfolios.
DIVESTMENTS
Under its strategy of portfolio arbitrage, Cofinimmo sold assets, mainly
offices and assets of distribution networks, for a net total price, after
deduction of transaction costs and fees, of €21.70 million.
Each transaction was realised with a gain or was in line compared to the
investment value determined by the expert and the weighted average gain
on the total disposals stands at 1.4%.
ASSET MANAGEMENT FOR THIRD PARTIES
In 2013, the Cofinimmo Group started an Asset Management activity for
third parties.
This ancillary activity is exercised by Cofinimmo Investissements et
Services (CIS), a subsidiary of the Group, and its contribution to the results
doesn’t exceed the threshold of 10% of the net revenues and profits of CIS
(see the chapter “Risk Factors” of this Annual Financial Report).
At 31.12.2013, Cofinimmo Investissements et Services managed a portfolio
of three healthcare assets in Belgium.
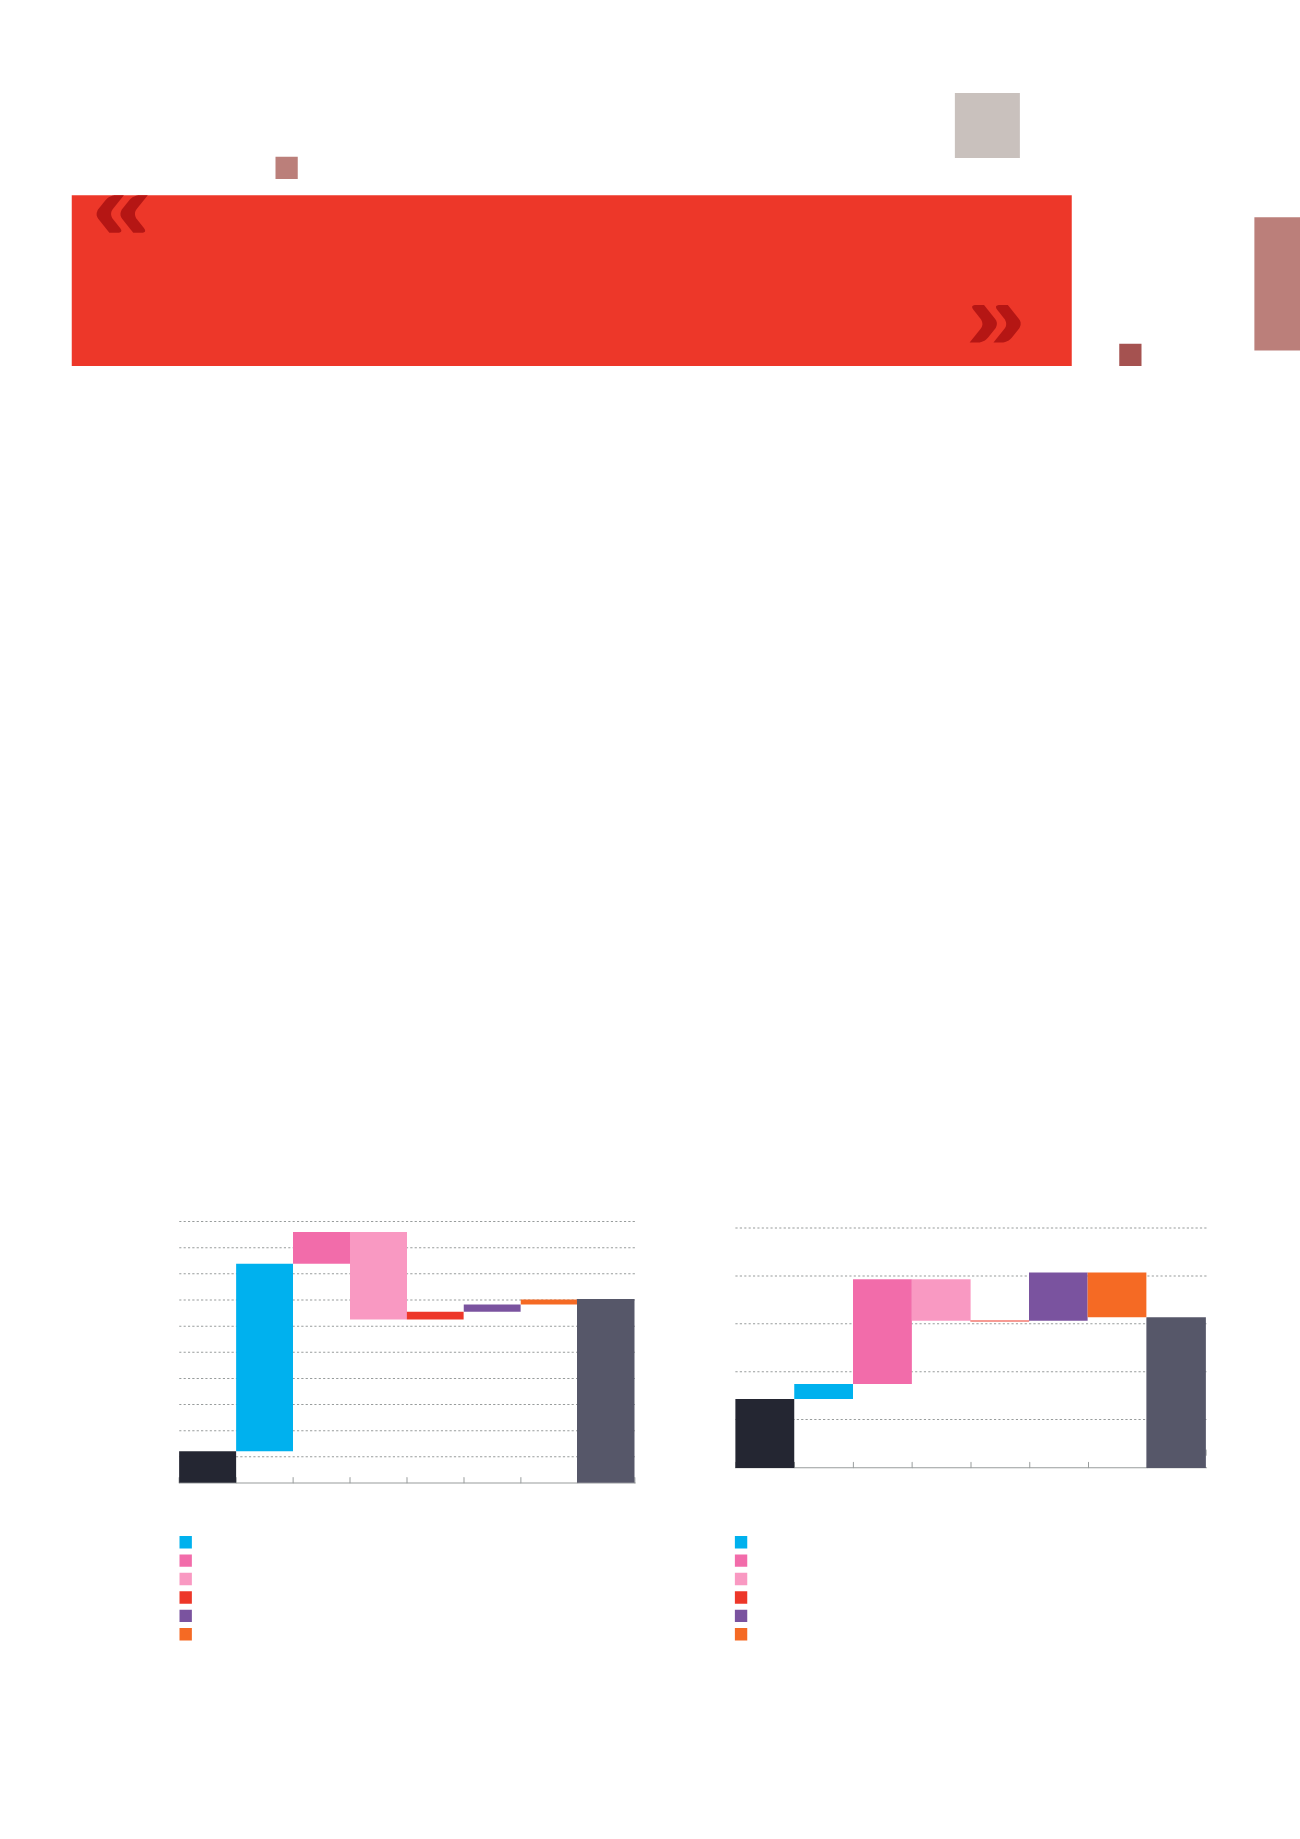
Evolution of the consolidated portfolio 1996-2013
2
(x €1,000,000)
5,000
4,500
4,000
3,500
3,000
2,500
2,000
1,500
1,000
500
0
3,546.28
603.88
-1,655.52
143.57 140.92 91.16
608.57
3,478.87
Portfolio
at 31.12.2013
Portfolio
at 01.01.1996
Acquisitions
Constructions and renovations
Net realisation value
Realised gains and losses compared to the last annual estimated value
Writeback of lease payments sold
Changes in the investment value of the protfolio
Acquisitions
Constructions and renovations
Net realisation value
Realised gains and losses compared to the last annual estimated value
Writeback of lease payments sold
Changes in the investment value of the protfolio
Evolution of the consolidated portfolio in 2013
2
(x €1,000,000)
Portfolio
at 31.12.2013
Portfolio
at 01.01.2013
1
Also see Note 20.
2
In investment value.
7.85
54.63
-21.70
0.11
25.28 -23.38
3,436.09
3,478.88
\ 23
Global Portfolio
\ Management Report