


 39 / 236

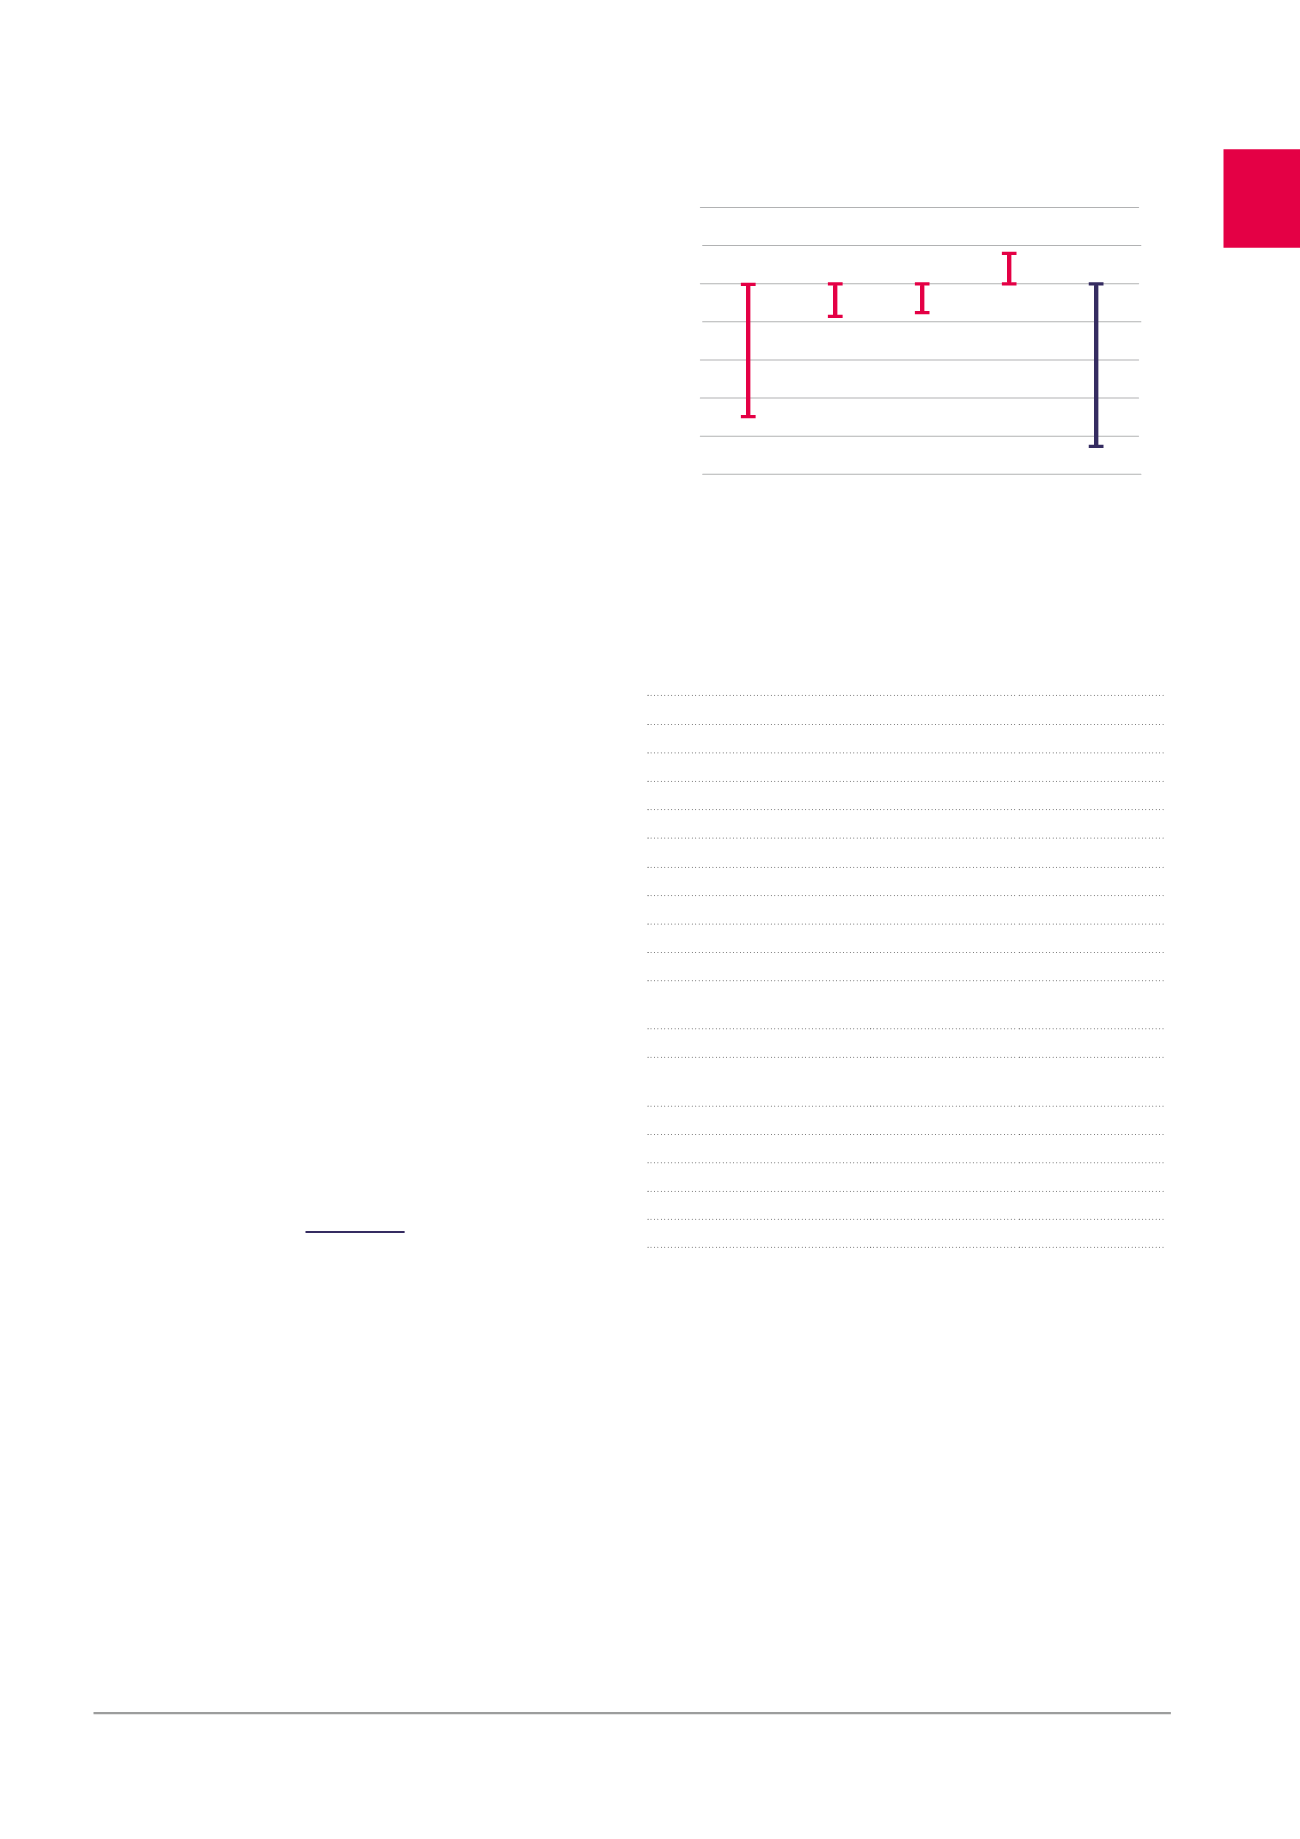
-4
2
1
0
-2
-6
-8
-10
Q1
Q2
Q3
Q4
Total 2015
-6.99 -1.76 -1.55
1.67
-8.62
Changes in the fair value of the
portfolio
The Cofinimmo portfolio, standing at 3,134.4 million EUR
1
at fair value on
31.12.2015, posted a decrease in fair value of -0.27% over the 12 months
of 2015, which corresponds to -8.6 million EUR.
This depreciation is made up as follows:
•
the “Office” segment posted a negative change in fair value of
-30.9 million EUR;
•
the “Healthcare real estate”, “Property of distribution networks“
and “Other” segments posted a positive change in fair value of
20.2 million EUR, 1.4 million EUR and 0.7 million EUR respectively.
The depreciation of the office portfolio comes from buildings under
renovation or requiring a significant renovation in the short term. This
is the case for the Souverain 23-25, Bourget 40 and Arts 19H buildings.
At the global portfolio level, this depreciation is partially offset by:
•
the indexation of the leases;
•
a high occupancy rate: 94.9% at 31.12.2015;
•
an average residual lease length which has increased from 6.7 years
at the end of 2004 to 8.4 years at the end of 2006, and then to
10.52 years at the end of 2015, an outstanding figure among the
European real estate companies.
“A PORTFOLIO’S
VALUATION HAS
BEEN OFFSET BY
A DIVERSIFICATION.”
Segment
Change in the
fair value at
1 year
Geographic
distribution by
sector
HEALTHCARE REAL ESTATE
1.5%
42.4%
Belgium
1.4%
24.8%
France
0.9%
12.2%
Germany
3.4%
2.1%
Netherlands
4.1%
3.3%
OFFICES
-2.4%
39.6%
Antwerp
0.9%
2.1%
Brussels Centre/Nord
1.5%
3.7%
Brussels Decentralised
-6.0%
16.9%
Brussels Leopold/Louise
1.1%
8.8%
Brussels Periphery &
Satellites
-2.0%
4.4%
Other
0.5%
3.7%
PROPERTY OF DISTRIBUTION
NETWORKS
0.3%
17.2%
Pubstone Belgium
-0.1%
8.8%
Pubstone Netherlands
-1.9%
4.7%
Cofinimur I - France
4.1%
3.7%
Other
2.6%
0.8%
TOTAL
-0.3%
100%
1
Including the impact of the investment expenditures capitalised during the year.
2
For the office portfolio alone, it stands at 4.3 year at the end of 2015.
Changes in fair value of investment properties in 2015
(x 1,000,000 EUR)
35