


 41 / 236

100
90
80
70
60
50
40
30
20
10
0
2011
25%
31%
42%
2012
2013
2014
2015
73%
2%
0
0.5
1
-2
-1.5
-1
-0.5
0.96 0.50 0.30 0.19
-1.06
-1.68
-0.70
95
100
90
94.9%
2009
2010
2011
2012
2013
2014
2015
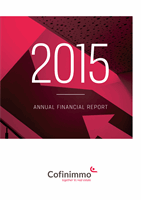
Occupancy rate of the portfolio (in %)
Healthcare real estate
99.2%
Offices
89.7%
Property of distribution networks
98.0%
Other
100%
GLOBAL PORTFOLIO
94.9%
Occupancy rate and rental vacancy
The diversification within the healthcare real estate sector and
the Pubstone and Cofinimur I portfolios, where the occupancy rate
reaches 100%, positively impacts the global occupancy rate reaching
94.9% and results in a better risk spread.
1
Spread over the firm length of the new and renegotiated lease agreements.
2
The occupancy rate is calculated by dividing the contractual rents of the current leases (indexed) by the sum of these contractual rents and the estimated rental values of the vacant
premises, the latter being calculated on the basis of the prevailing market rents.
3
Source: CBRE.
4
The renegotiations of rental agreements were done at less favourable conditions than the previous agreements for the same spaces.
On a like-for-like basis, the gross rental income decreased by 0.70%
in 2015: the negative effect of departures (-2.05%) and renegotiations
(-0.39%) was mitigated by the positive effect of lease indexations
(0.45%) and new lettings (1.29%).
Office portfolio
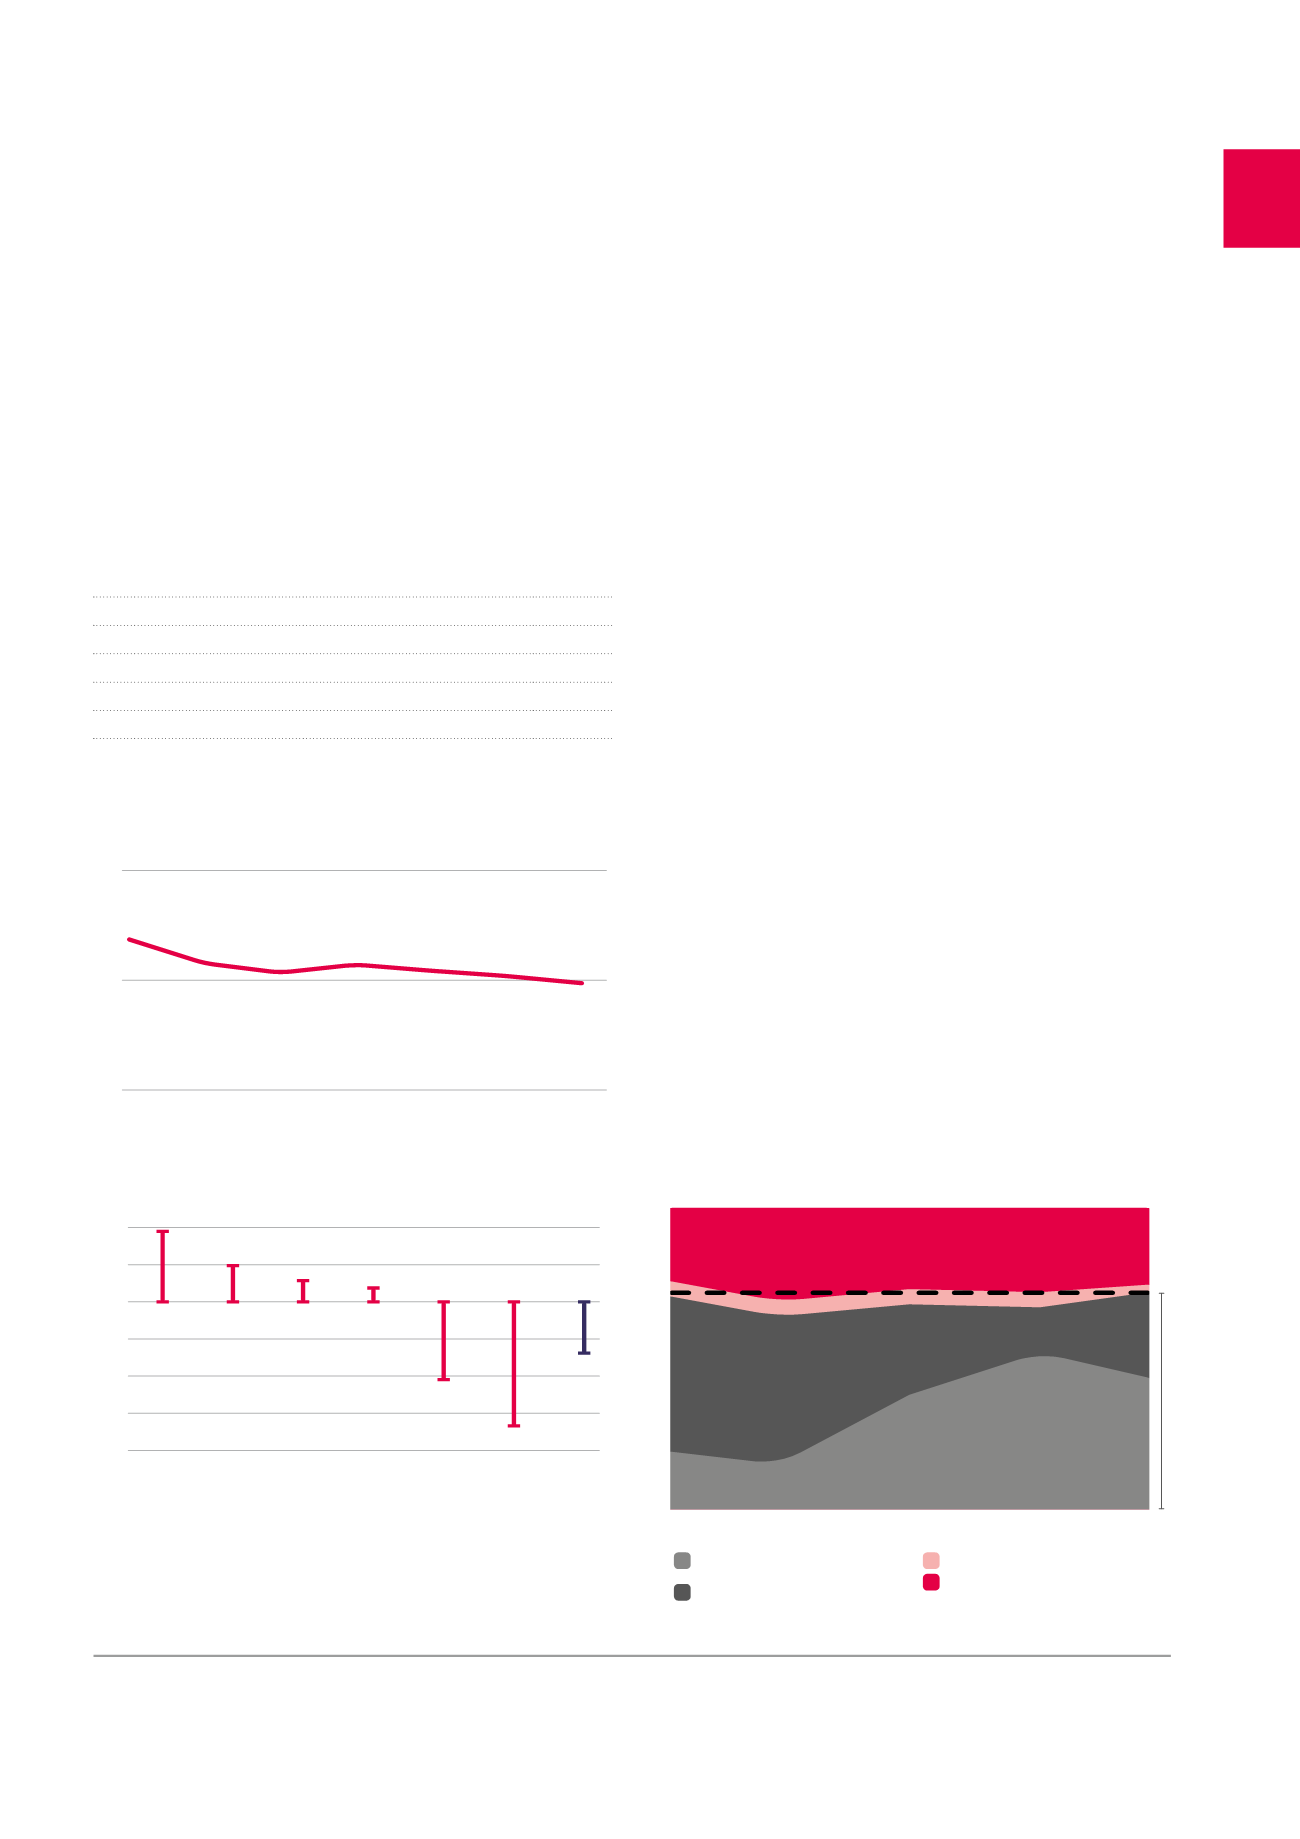
The rental vacancy risk faced by Cofinimmo each year represents on
average 5% of its overall poertfolio and 10 to 15% of its office portfolio
alone. The letting team pays special attention to the clients whose
leases are considered at risk. The treatment of the rental vacancy risk
in 2015 shows that 73% was secured through renegotiations, unexer-
cised breaks and lease renewals. This percentage of tenant retention
reaches 75% if the new leases that were signed and took effect during
the year are also taken into account.
During the financial year 2015, cofinimmo signed leases for over
67,200 m
2
of office space, representiong contractually guaranteed
revenues, net of rent-free periods, of 37.7 million EUR.
1
The most impor-
tant transactions are related to the buildings Bourget 42, Mercurius 30,
Guimard 10-12 and The Gradient (formerly Tervuren 270-272).
The occupancy rate
2
remains high at 89.7% (versus 89.9% for the
Brussels office market average
3
). This is the result of the commercial
strategy based on the relationship of trust with the clients, leading to a
favourable evolution of the operating margin.
Evolution of rental income on a like-for-like basis 2015 vs. 2014
(in %)
Healthcare
real estate
Netherlands
Healthcare
real estate
Belgium
Other
Healthcare
real estate
France
Property of
distribution
networks
Offices
Total
portfolio
Evolution of the occupancy rate of the portfolio (in %)
Unexercised breaks or lease
renewals
Renegotiations
New leases
Effective departures
Vacancy risk handling of the office portfolio (in %)
4
37