


 99 / 236

1
1
3
3
3
7
2
12
6
6
6
4
2
13
1
10
1
GRIMBERGEN
ASSE
BEERSEL
HALLE
ITTRE
NIVELLES
OTTIGNIES
WAVRE
OVERIJSE
TERVUREN
BRUSSELS
E40
GHENT/
OSTEND
E19
ANTWERP
E19
CHARLEROI
A8
TOURNAI
E411
LUXEMBOURG
VILVOORDE
LEOPOLD
Groot-
Bijgaarden
WATERLOO
BRAINE-L’ALLEUD
DIEGEM
ZAVENTEM
E40
LIÈGE/LEUVEN
x
x
x
x
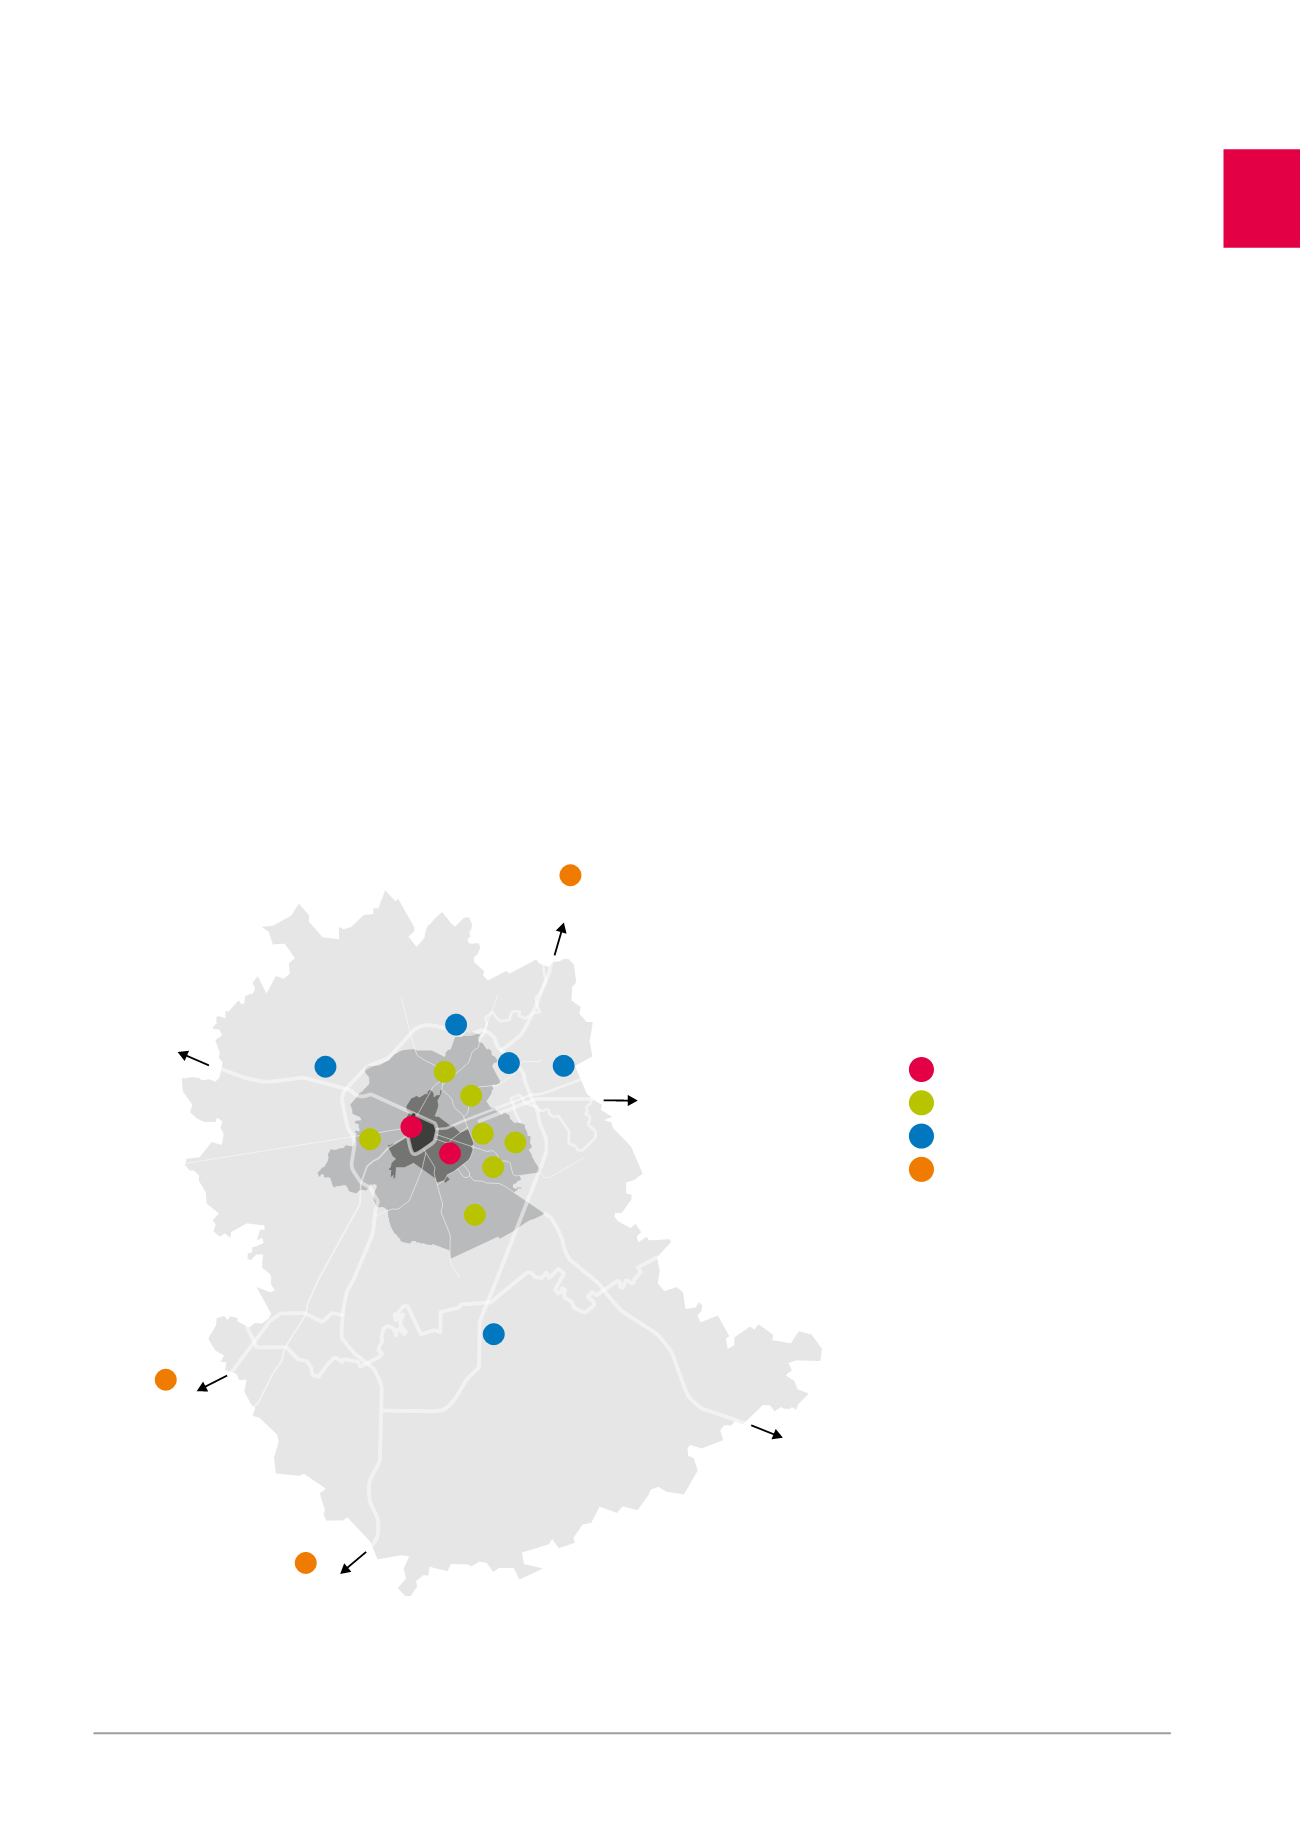
The office rental market in Brussels
Demand
Despite some timid signs of recovery, rental demand on the Brussels
real estate market reached 325,577 m
2
in 2015, down compared with
2014.
The absence of significant transactions (no transactions above
20,000 m
2
recorded) and a longer decision-making process within
European institutions weighed on letting in 2015. The year’s two largest
transactions are the letting by KPMG of 13,000 m
2
in the PassPort build-
ing and by CPAS de Schaerbeek of 10,000 m
2
in the Silver Building.
The breakdown of rental demand in 2015 was 45% in the CBD, 20% in
Decentralised Brussels and 35% in the Brussels Periphery.
Supply
During financial year 2015, 64,074 m² in new office space was delivered
on the Brussels market. There were few speculative investments,
which confirms the trend observed since 2011 of an extremely low
volume of “risky” deliveries.
In 2016, 134,000 m
2
of space is expected on the market, including
100,000 m
2
already pre-let.
Vacancy
In 2015, the rental vacancy on the Brussels office market decreased
slightly, from 10.6% at 31.12.2014 to 10.1% at 31.12.2015. This decline is
explained by the small quantity of new speculative buildings placed
on the market and the conversion of office buildings to other uses
(residential, hotel, nursing home, etc.).
The disparities between districts are significant. The CBD has a “stable”
vacancy rate of 6.9%, whereas the periphery struggles to reduce its
vacancy rate, which is still 16%. Furthermore, there are also disparities
between building types, with “Grade A”
1
buildings being the most in
demand.
The Brussels office property investment market
In 2015, 1.1 billion EUR was invested in the office segment in Brussels.
Prime yields for offices in Brussels remain under pressure: at the end
of 2015, they amounted to 5.25% for assets let under a 3/6/9 lease and
below 5% for assets under long-term leases.
1
Grade A: new development or renovation according to the latest standards, including sublet spaces in new/renovated buildings which have not been previously occupied.
Central Business District
Decentralised
Periphery & Satellites
Other
(x = number of establishments)
95