


 25 / 48

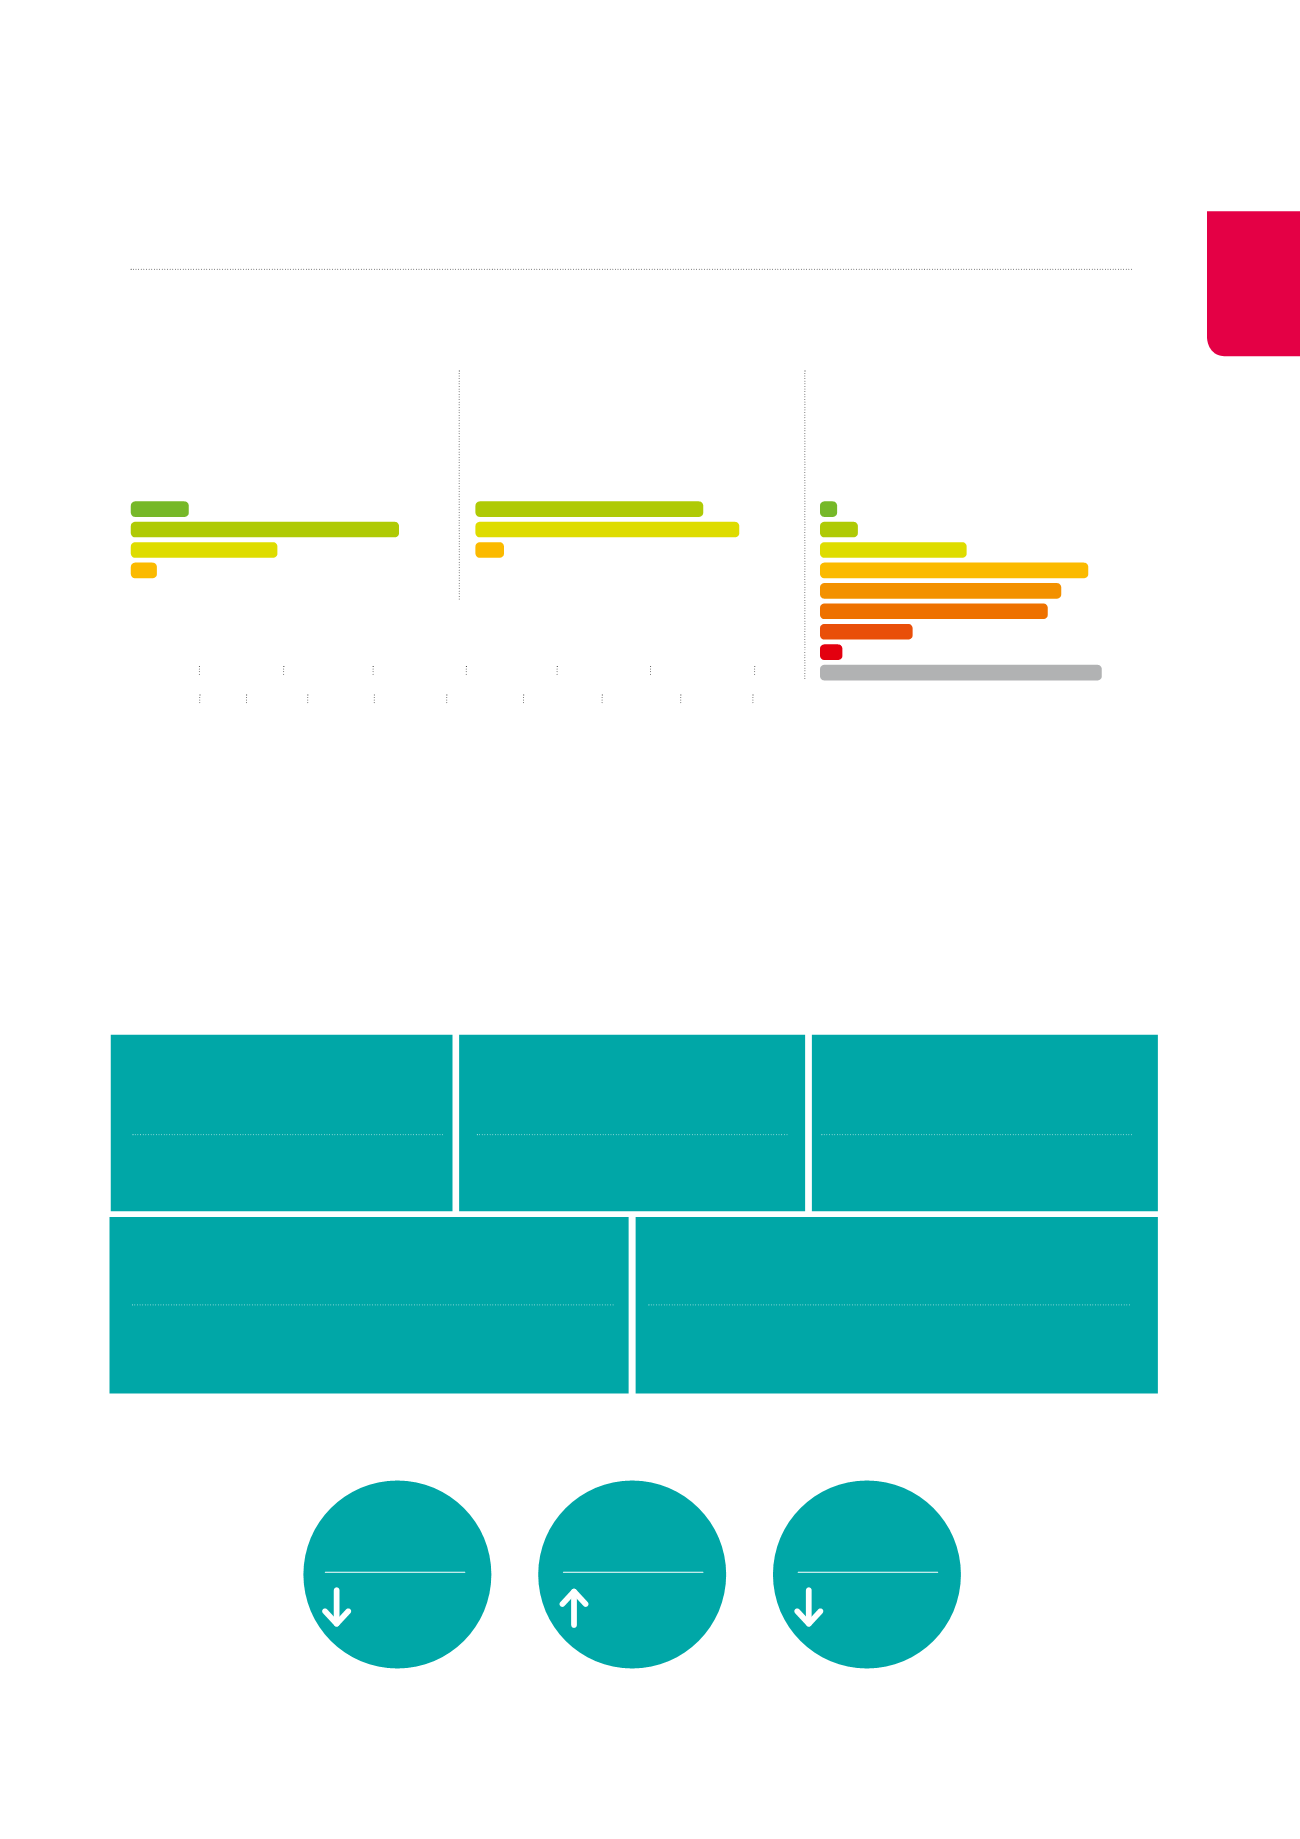
Performance indicators
Offices in Brussels
1
The current average of the buildings situated
in Brussels lies between D and E (source
IBGE/BIM). 27 buildings certified (32.5% of the
office space)
Healthcare real estate
2
32 care homes certified in France,
or 19.4% of the healthcare property
portfolio
Property of distribution networks
3
Cofinimur: MAAF agencies in France
The energy mapping of MAAF agencies
has been known since their acquisition.
Energy performance
B
12%
C
D
E
52%
30%
6%
C
D
E
44%
50%
6%
A
F
G
H
I
1%
C
D
E
3%
11%
20%
18%
17%
7%
2%
21%
not calculated
Consumption
Cofinimmo has adopted the performance indicators recommended
by the European Public Real Estate Association (EPRA). Drawn from
the Global Reporting Initiative (GRI), these 11 indicators give a very
clear picture of the various buildings’ performance year on year.
The data are calculated on the basis of information in the posses-
sion of Cofinimmo as owner and Cofinimmo Services as manager
of its real estate portfolio. They also include data obtained from the
buildings’ occupants.
Complete results (gross and normalised) can be found on
the website
www.cofinimmo.com/sustainable-development/performances-and-objectives.
They relate to surface areas used as offices in the offices and
PPP segments (731,117m²) and, for the first time, a sample of
surface areas used as nursing homes (57,828m²) out of a total of
1,780,357m².
Total consumption of energy from
fuels (GRI G4-EN3)
61,379
MWh/year
Total consumption of electrical
energy (GRI G4-EN3)
97,334
MWh/year
Relative energy consumption
(GRI G4-CRE1)
202
kWh/m²/year
Total direct and indirect greenhouse gas emissions
(GRI G4-EN15 and GRI G4-EN16)
78,732
tonnes of CO
2
e/year
Relative greenhouse gas emissions
(GRI G4-CRE3)
98
kg CO
2
e/m²/year
1
Not applicable to Flanders and Wallonia
2
In Belgium, only service flats have to comply with E-Level requirements, namely
those applicable to residential properties.
3
No compulsory energy efficiency measures currently exist for this type of
building, except for flats located above establishments. An energy performance
certificate has been produced for 29 of the 77 flats.
Energy kWh EP/m²/year
A < 62
B 62-155 C 156-248 D 249-341
E 342-434 F 435-527
G > 527
Belgium
France A < 51 B 51-90 C 91-150 D 151-230 E 231-330 F 331-450 G 451-590 H 591-750 I > 750
Changes on a like-for-like basis between 2013 and 2014
Gas consumption
at constant
climate
10.3
%
Electricity
consumption
2.6
%
Greenhouse gas
emissions
12.4
%
23